Manage canvas data
After querying and displaying graph data (nodes and edges) on the canvas, you can manage the data. This topic explains how to manage canvas data, including filtering, viewing, saving, exporting, and zooming.
Prerequisites
- Before managing canvas data, you need to query data on the Graph Query pane and display it on the canvas. For more information, see Explore subgraphs.
- To perform the operations in this topic, you must be granted related roles. For more information, see Account user management.
Filter canvas data
Required role: Project Admin or Project Member
You can filter the data on the canvas to better view specific data.
Filter conditionally
You can filter specific data to be displayed on the canvas based on filter conditions. The steps are as follows:
- In the left navigation bar of the canvas, click the
 icon.
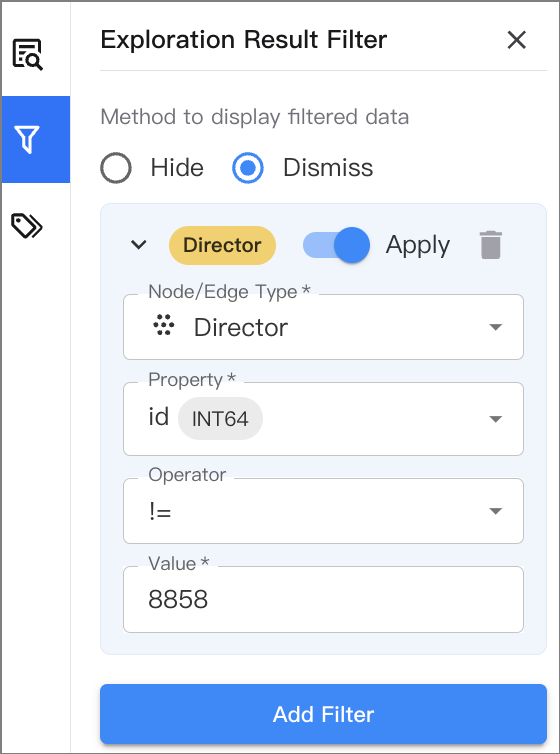
icon. - Set the display method for data that does not meet the conditions: Hide or Dismiss.
- Hide: Data that does not meet the conditions is hidden and not displayed on the canvas.
- Dismiss: Data that does not meet the conditions is grayed out.
- In the Exploration Result Filter pane, set the filter conditions. Data that meets the conditions is displayed on the canvas, while data that does not meet the conditions is hidden or grayed out.
- Node/Edge Type: The node type or edge type to be displayed. Data of this type that does not meet the conditions is filtered out.
- Property: The property of the node or edge to be displayed.
- Operator: The operator for the filter condition.
- Value: The value of the property.
- Click Apply.
To filter multiple node types or edge types, click Add Filter and repeat the above steps.
Filter by data type
In addition to filtering specific data based on conditions, you can also filter data of the same type based on the selected node type or edge type. The steps are as follows:
- In the lower right navigation bar of the canvas, click
 .
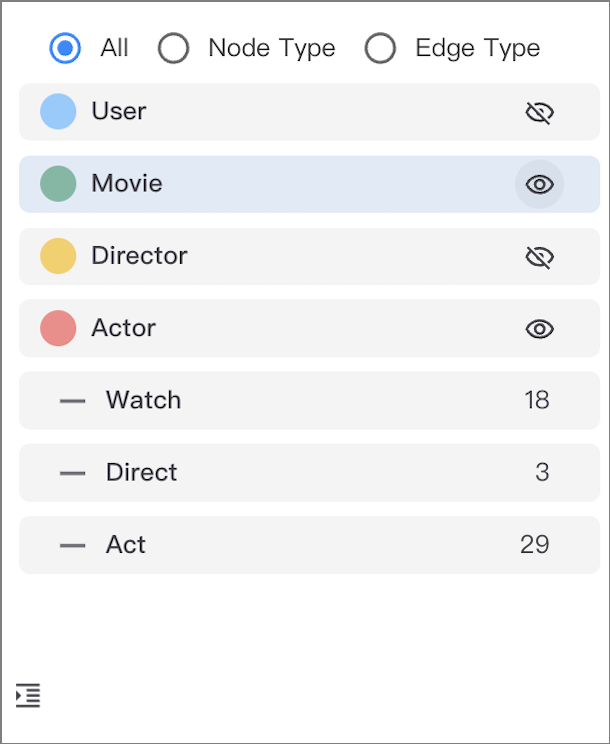
. - On the All tab, all node types and edge types on the canvas are displayed by default.
- You can click the Node Type tab to filter nodes by node type.
- You can click the Edge Type tab to filter edges by edge type.
- Select the node type or edge type you want to hide, and click
 . To show the data again, click
  .
.
Filter using the search box
In the top navigation bar of the canvas, click  , and enter the property value of the node or edge in the search box to filter the data to be displayed based on that value.
Display canvas data properties
Required role: Project Admin or Project Member
You can configure whether to display the properties of nodes and edges on the canvas.
- In the left navigation bar of the canvas, click the
 icon.
icon. -
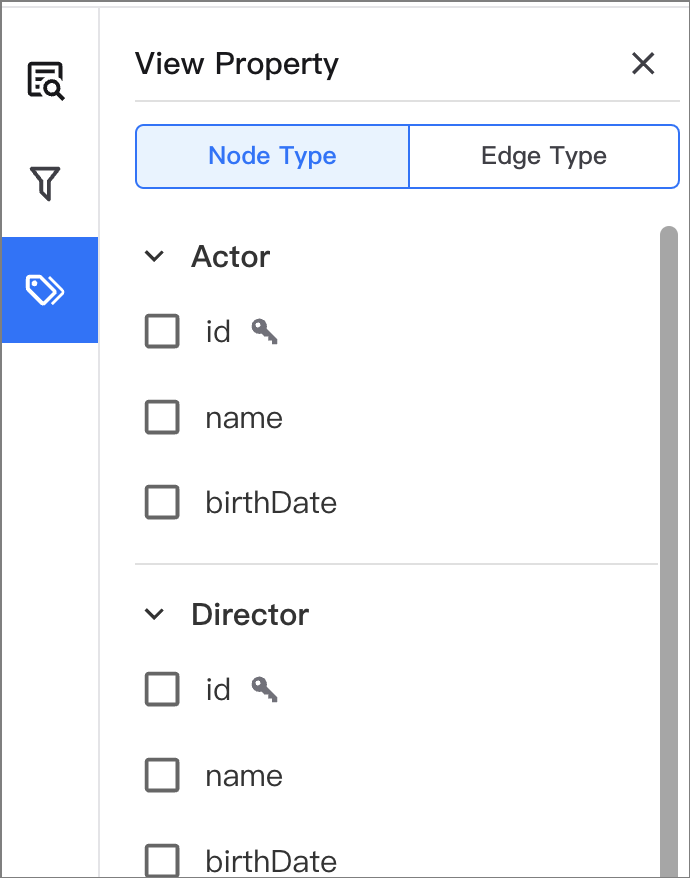
Configure whether to display the properties of nodes and edges on the canvas.
- To display properties, check the property names.
- To hide properties, uncheck the property names.
View canvas data information
Required role: Project Admin or Project Member
You can view information about the data on the canvas, including data volume and properties.
View canvas data statistics
In the lower right navigation bar of the canvas, click  to view the number of nodes and edges on the canvas.
View canvas data properties
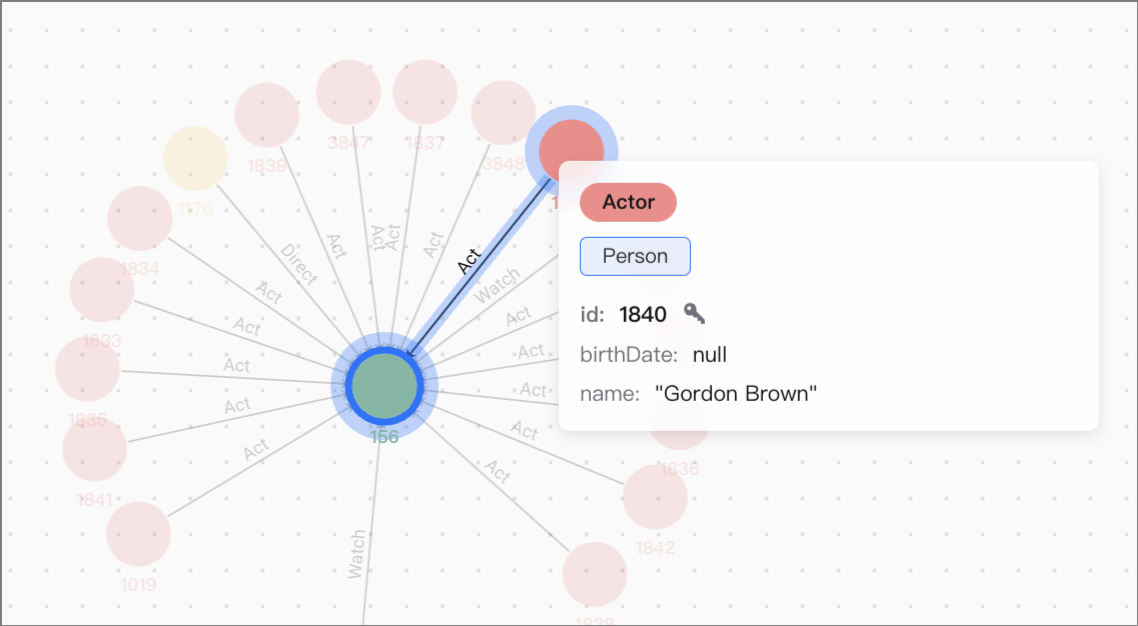
In the canvas, hover the mouse over the target node or edge to automatically display the data information, including data type, labels, properties, etc.
Set canvas data styles
Required role: Project Admin or Project Member
Set style for a single node or edge
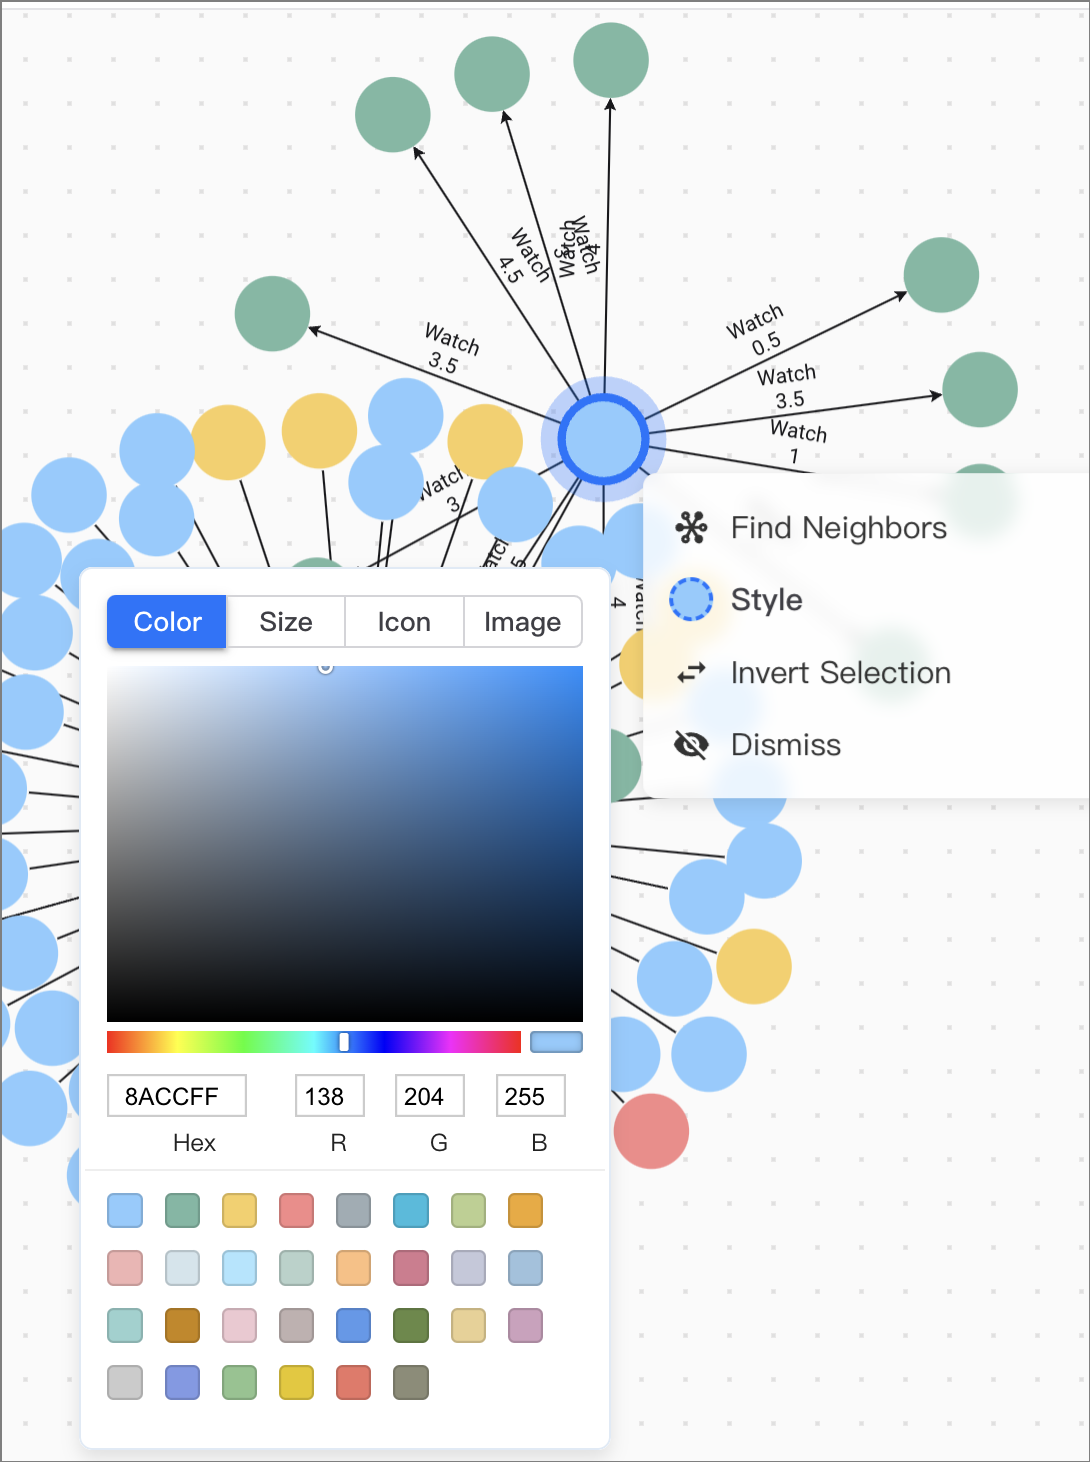
- On the canvas, select the target node or edge and right-click.
- Click Style.
-
In the style setting panel, set the style for the node or edge.
- For the node, you can set the color, size, icon, and image.
- For the edge, you can set the color and size.
Set style for multiple nodes or edges of the same node type or edge type
- In the lower right navigation bar of the canvas, click the
 icon.
icon. -
Select the target node type or edge type to configure the style for all nodes or edges of that type simultaneously.
- For nodes of the same type, you can set the color, size, icon, and image.
- For edges of the same type, you can set the color and size.
Set canvas data layouts
Required role: Project Admin or Project Member
In the lower right navigation bar of the canvas, click  to set the layout of the canvas data.
NebulaGraph Cloud supports 8 layout methods to display the relationships between data on the canvas.
| Layout | Icon |
|---|---|
| Force |  |
| Dagre |  |
| Dagre-LR |  |
| Circular |  |
| Grid |  |
| Radial |  |
| Concentric |  |
| Neural Network |  |
Save canvas data
Required role: Project Admin or Project Member
In the upper right corner of the canvas, click  to save the data to the exploration. The saved exploration can be viewed on the Exploration List page.
Export canvas data
Required role: Project Admin or Project Member
Export all canvas data
In the upper right corner of the canvas, click  to export the data on the canvas. The export formats include PNG, JSON, and CSV.
Export selected canvas data
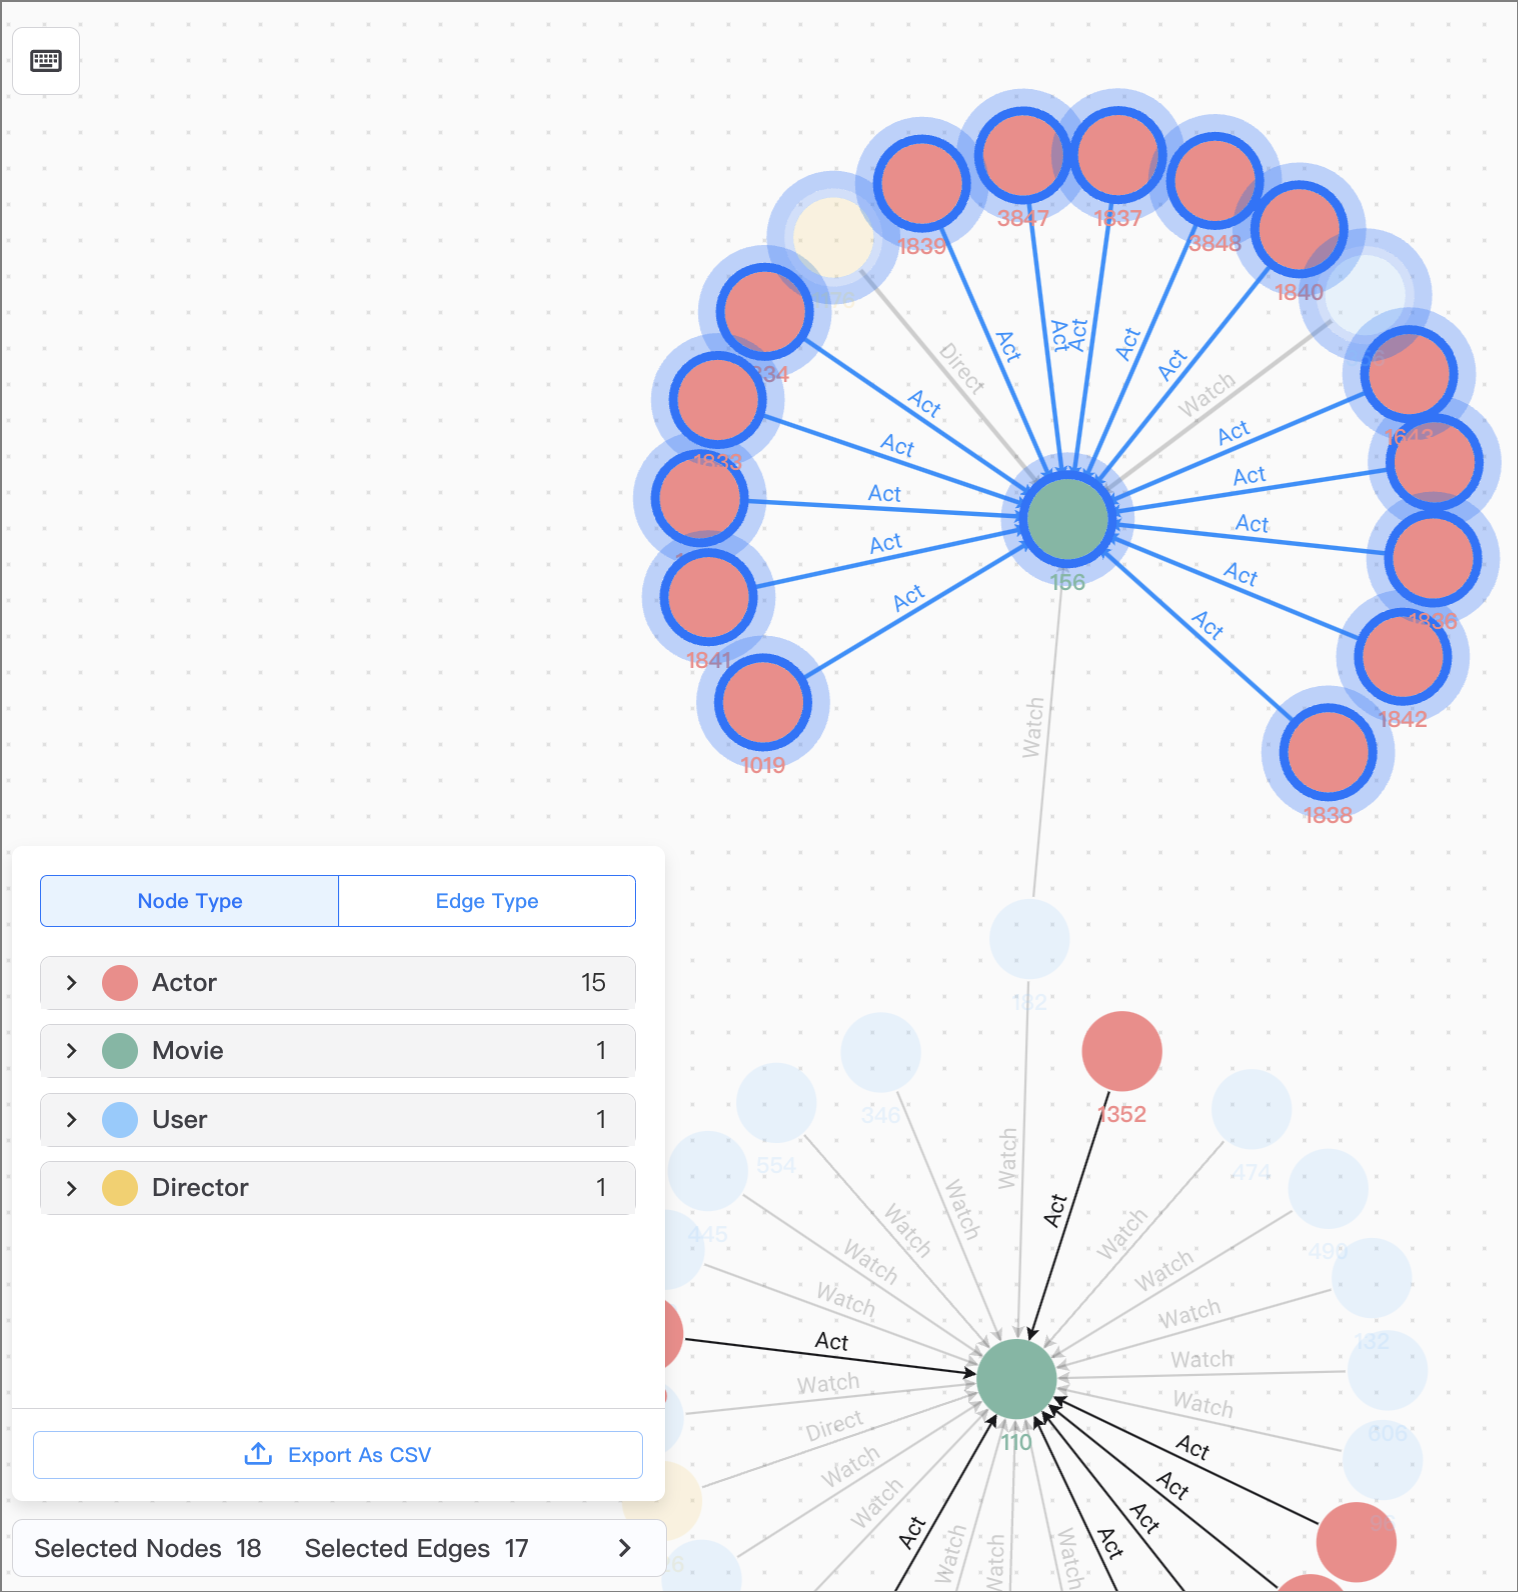
In addition to exporting the entire canvas data, you can also export the selected nodes or edges. The export format is CSV.
- Select the nodes or edges to be exported.
- In the lower left corner of the canvas, click
 .
. - Click Export as CSV.
Zoom canvas data
Required role: Project Admin or Project Member
In the lower right corner of the canvas, you can zoom the canvas data in the following ways:
