NebulaGraph Dashboard
Visual Management and Monitoring tool for NebulaGraph Database
An intuitive interface to manage, monitor, and maintain NebulaGraph Database clusters
Helps DBAs improve efficiency and resolve issues faster
Included with your NebulaGraph Database Enterprise Version installation

NebulaGraph Dashboard is a browser-based visual management and monitoring platform for NebulaGraph Database. It provides an intuitive graphical interface that helps database administrators (DBAs) efficiently deploy, manage, monitor, and maintain NebulaGraph Database clusters.
With NebulaGraph Dashboard, users can centrally manage clusters, services, hosts, and configurations without relying on complex command-line operations. It supports cluster lifecycle management, service and host monitoring, configuration management, and customizable dashboards with real-time metrics, enabling teams to improve operational efficiency, reduce maintenance complexity, and quickly identify potential issues.

Centralized Cluster Management
Manage clusters, services, hosts, and configurations through an intuitive visual interface.

Real-Time Monitoring and Insights
Monitor resource usage, service performance, and query statistics with customizable dashboards.

Efficient Operations and Troubleshooting
Quickly detect issues and optimize database operations with comprehensive monitoring capabilities.

Manage your entire NebulaGraph Database infrastructure from a single, intuitive interface. NebulaGraph Dashboard streamlines cluster lifecycle management by enabling administrators to create, manage, and maintain clusters with ease, reducing operational complexity and improving day-to-day efficiency. Operators can use the Cluster Management dashboard to track CPU and Memory utilization and monitor latency on select operations.
Keep critical database services running smoothly with centralized service management. NebulaGraph Dashboard provides real-time visibility into Graph, Meta, and Storage services, allowing administrators to monitor service health, perform start, stop, and restart operations, and scale Graph or Storage services as business demands evolve.


Monitor the health of your infrastructure without switching between multiple tools. NebulaGraph Dashboard gives administrators a clear view of host-level resources—including CPU, memory, disk utilization, and system load—making it easier to optimize resource allocation and maintain cluster stability.
Reduce the risk of configuration errors with centralized configuration management. NebulaGraph Dashboard enables administrators to view and update service configurations through an interface, helping teams maintain consistent environments while simplifying routine maintenance.

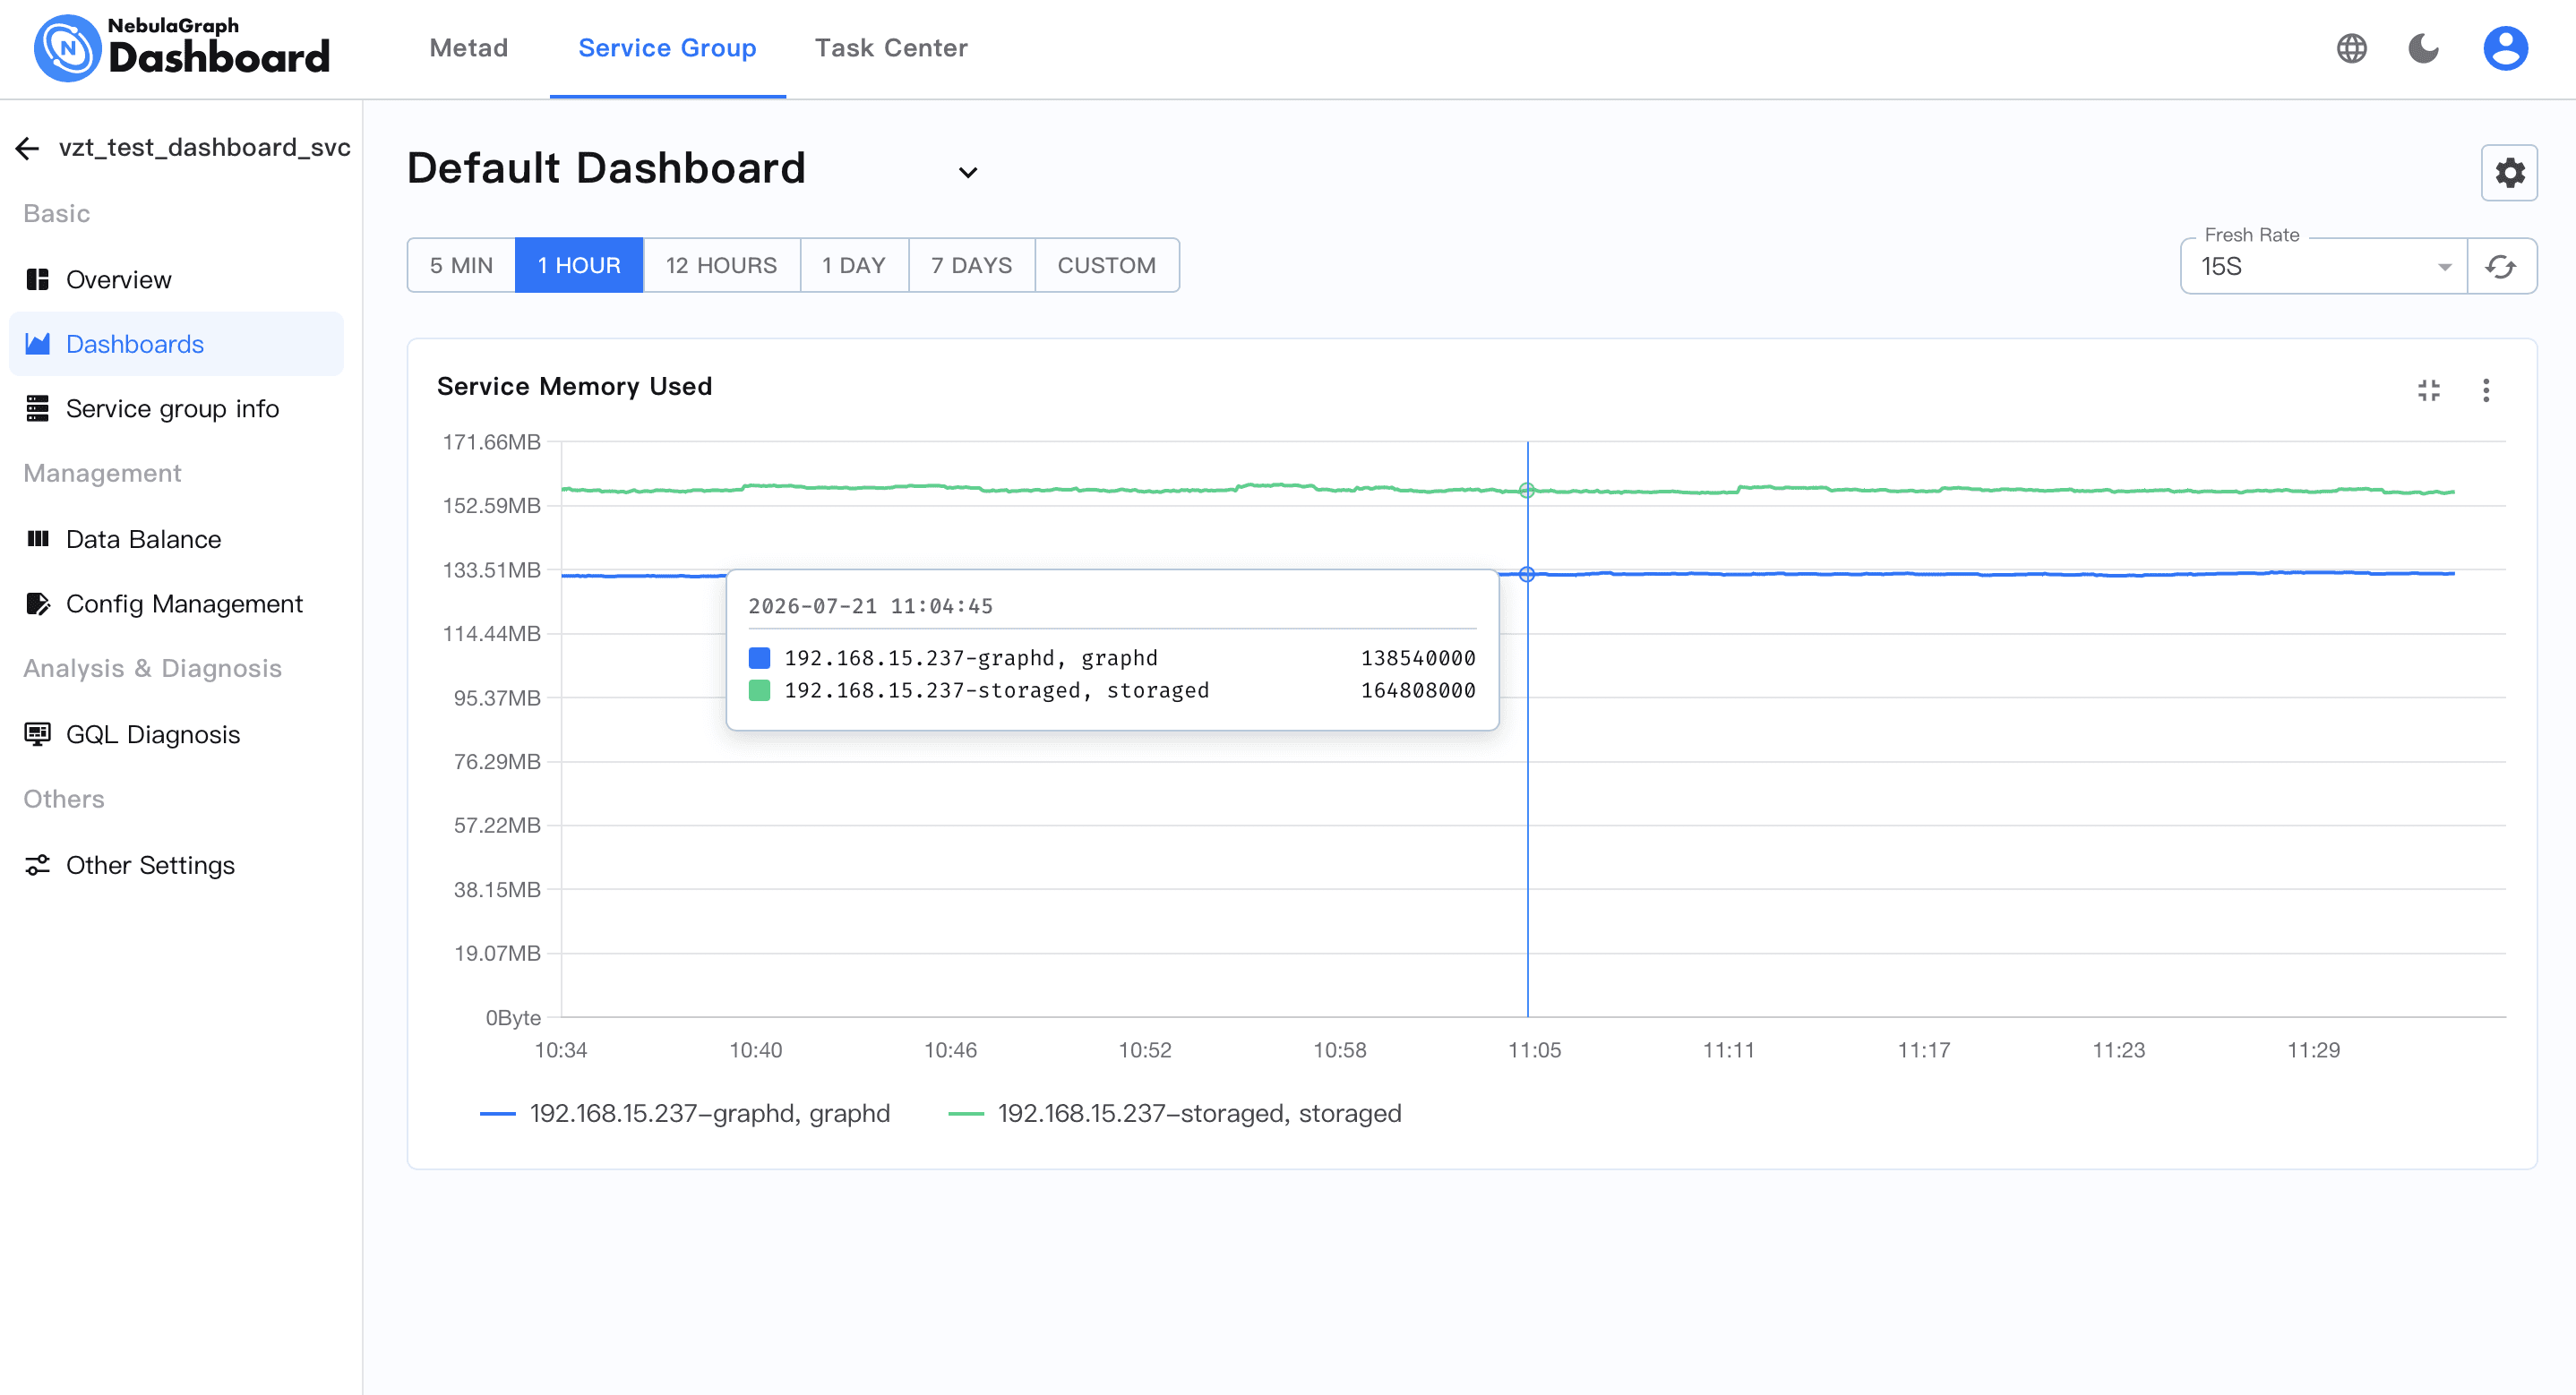
Stay ahead of performance issues with comprehensive, real-time monitoring. NebulaGraph Dashboard visualizes key operational metrics—including resource utilization, service performance, and query statistics—through customizable dashboards, enabling administrators to identify bottlenecks, diagnose issues faster, and ensure optimal database performance.