Graph Computing
Apr 2, 2026
Billion-Relation Analytics in the AI Era: NebulaGraph Analytics
NebulaGraph
In today’s data-driven landscape, organizations are increasingly relying on graph databases to manage and query interconnected data at massive scales. However, storing that data is only half the battle. The real competitive advantage lies in what you can compute on top of it.
As businesses move from simply “storing connections” to “deriving intelligence from connections,” the need for a powerful, flexible, and scalable graph analytics solution becomes critical. This is where NebulaGraph Analytics comes in.
Designed to run complex, custom algorithms directly on your most demanding graph workloads, NebulaGraph Analytics empowers your teams to move beyond pre-packaged solutions and build algorithms that perfectly mirror your unique business logic.
The Core Challenge: Moving from Storage to Actionable Computation
Many organizations face an unspoken reality: after building a massive graph database, they discover they can't effectively compute on it. Standard graph algorithms like PageRank, community detection, and shortest path—workhorses in many production environments—begin to break down at this scale. They become too slow, too resource-intensive, or simply impossible to run on the full dataset.
The Graph Database market is growing—projected to grow from $2.85 billion in 2025 to over $20 billion by 2034—but the real need has evolved from storing graphs to computing on them intelligently. Business users should be able to define their own analytical rules, iterate quickly, and deploy algorithms without months of development overhead.
This is the gap that NebulaGraph Analytics is built to fill.
Why Custom Graph Algorithms Are Non-Negotiable
Before diving into the capabilities of NebulaGraph Analytics, it’s important to understand why the ability to define custom algorithms is not just a “nice-to-have” but a fundamental requirement for serious graph analytics.
Off-the-Shelf Algorithms Are Rarely Enough: Standard algorithms provide a great starting point, but they almost never map perfectly to a specific business problem. Real-world use cases—like detecting a novel fraud pattern or calculating a unique influence score—require algorithm tuning, parameter adjustments, and often, significant logical modifications.
Business Logic Must Remain Proprietary: In sensitive areas like financial risk or anti-money laundering, the very logic that keeps your business safe is a core intellectual asset. Outsourcing the implementation of these rules to a third party is often not an option.
Speed of Iteration is Everything: Threats and business models change rapidly. The time it takes to communicate a need to a product team, wait for development, and then deploy an updated algorithm is often measured in weeks or months—a delay that can lead to missed opportunities or increased risk.
Performance is Intricately Tied to Business Needs: The effectiveness of an algorithm is judged by its business outcome. Fine-tuning that outcome requires a tight feedback loop between the domain expert and the algorithm itself, a loop that breaks if an external vendor or a different team controls the implementation.
Therefore, a truly production-ready graph analytics product must empower its users to own their algorithms entirely, from concept to execution.
Key Capabilities of NebulaGraph Analytics
NebulaGraph Analytics is architected around the real-world constraints of large-scale graph computation in production environments: scalability, cost control, business-specific customization, seamless data integration, and operational reliability. Its capabilities are designed to address these constraints head-on.
1. Business-Driven Custom Algorithm Development with GQL
The cornerstone of NebulaGraph Analytics is its open and flexible approach to algorithm development. Instead of limiting users to a set of pre-packaged functions, it allows them to write their own algorithms using a new and powerful language: GQL.
This is a paradigm shift. It moves graph analytics from being a function you call to being a model you build for your specific business context.
Unified Semantics: By using GQL, the language used to query the graph itself, NebulaGraph Analytics creates a single, unified semantic environment. This means that business users and analysts can focus on the what (the business logic) rather than the how (the underlying distributed computing framework).
Low Learning Curve: GQL is designed for working with graph data. Its declarative nature means it is far more accessible than low-level languages like C++ or Java. Domain experts can learn to read, write, and modify algorithms with minimal overhead, bypassing the traditional development bottleneck.
AI-Assisted Development: To further accelerate the process, NebulaGraph Analytics integrates with Large Language Model (LLM) capabilities. By providing natural language prompts, users can generate functional algorithms in seconds, compressing development cycles from weeks to hours. This empowers teams to iterate on their analytical logic at the speed of business, not the speed of engineering.
Full Control Over Logic: Users aren't just tweaking parameters; they can extend, combine, or fundamentally rewrite algorithms. For instance, a risk analyst could create a hybrid algorithm that first finds communities and then runs a custom path-finding function within those communities based on transaction types and thresholds.
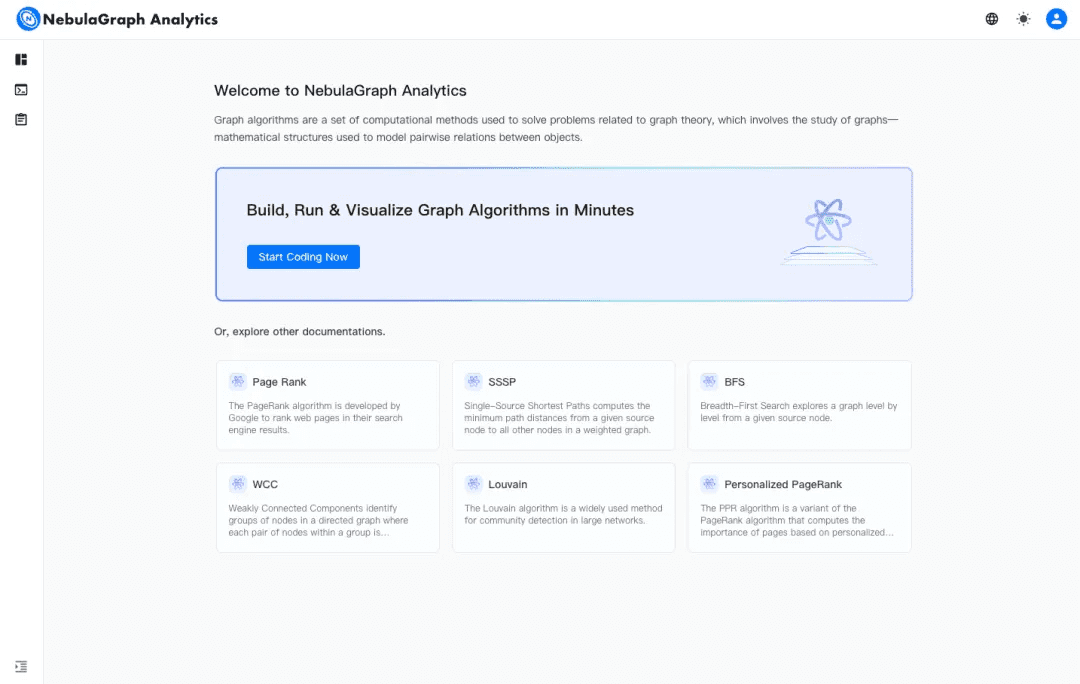
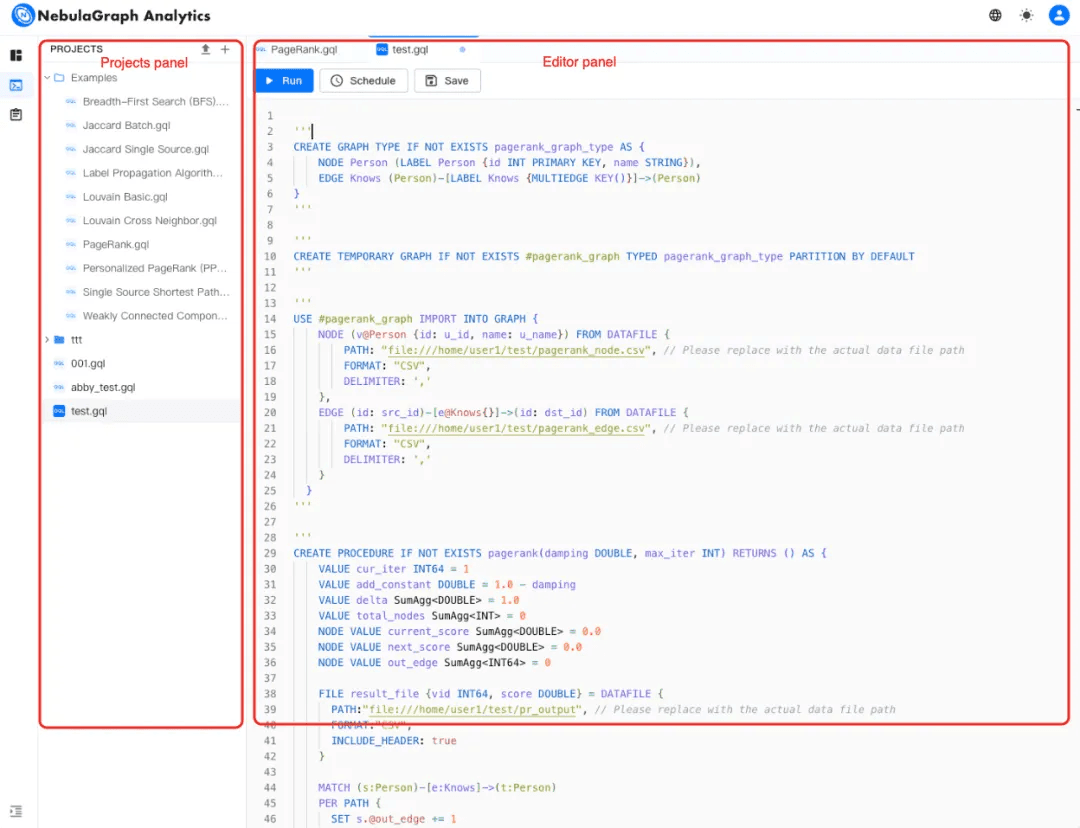
The visual development environment, complete with project management, a code editor with syntax highlighting, and the ability to run jobs in temporary or scheduled modes, makes the entire process intuitive and production-ready.
2. Heterogeneous Data Integration
Data in modern enterprises rarely resides in a single location. It lives in graph databases, data lakes, cloud storage, and on-premise systems. A powerful analytics solution must be able to reach out and access it.
NebulaGraph Analytics is built for this reality. It features a robust, multi-source data ingestion engine that can import data from:
Local file systems
HDFS
Amazon S3
Google Cloud Storage
It supports a wide variety of common data formats, including CSV, Parquet, and ORC. This flexibility allows organizations to adopt NebulaGraph Analytics without needing to overhaul their existing data architecture. It effectively adds a powerful graph computation layer on top of their current data ecosystem, enabling insights without the friction of complex data migration.
NOTE: It is not necessary to move your data to NebulaGraph Database in order to use NebulaGraph Analytics.
3. Production-Ready Job Management and Scheduling
Graph analytics in the real world is not a one-off experiment; it’s a continuous operational process. Whether it’s recalculating community memberships for a user base, running daily fraud detection scans, or providing up-to-date risk scores for a live system, the process needs to be reliable, repeatable, and automated.
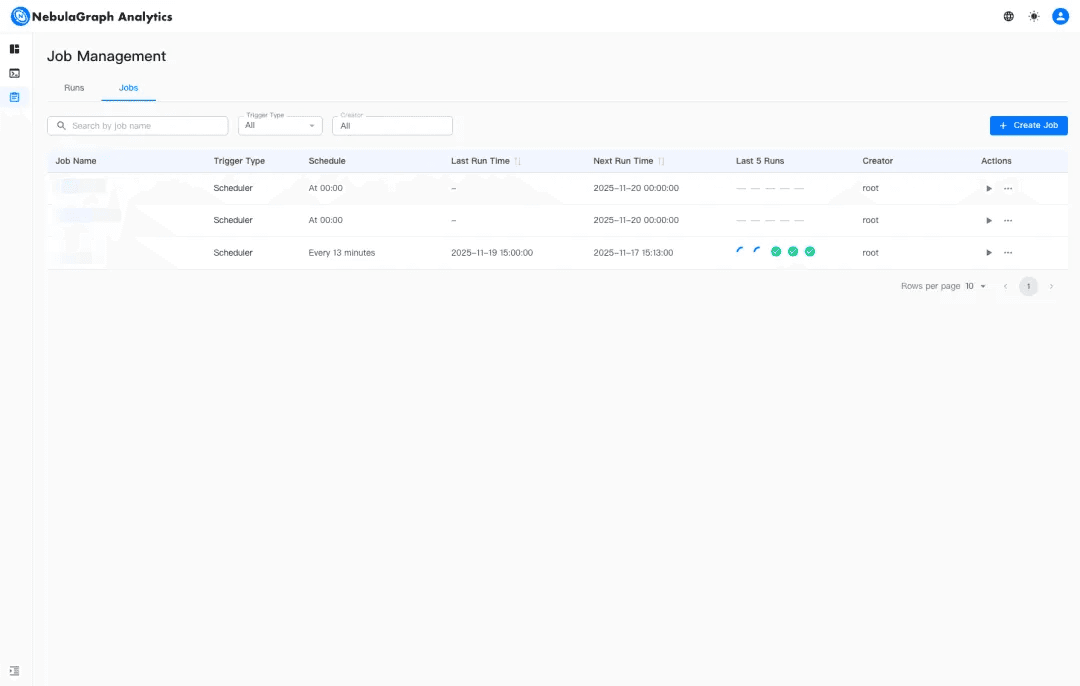
NebulaGraph Analytics provides a visual, centralized job management interface to handle these production needs. This interface allows you to:
Develop and Configure: Create and fine-tune your analytics jobs within the visual studio.
Manage and Monitor: View all jobs, search by name, and filter by trigger type. You can perform full lifecycle management—creating, updating, pausing, and deleting jobs.
Schedule Automatically: Set up timed schedules for jobs to run on a recurring basis, ensuring that your downstream systems always have access to fresh analytical results.
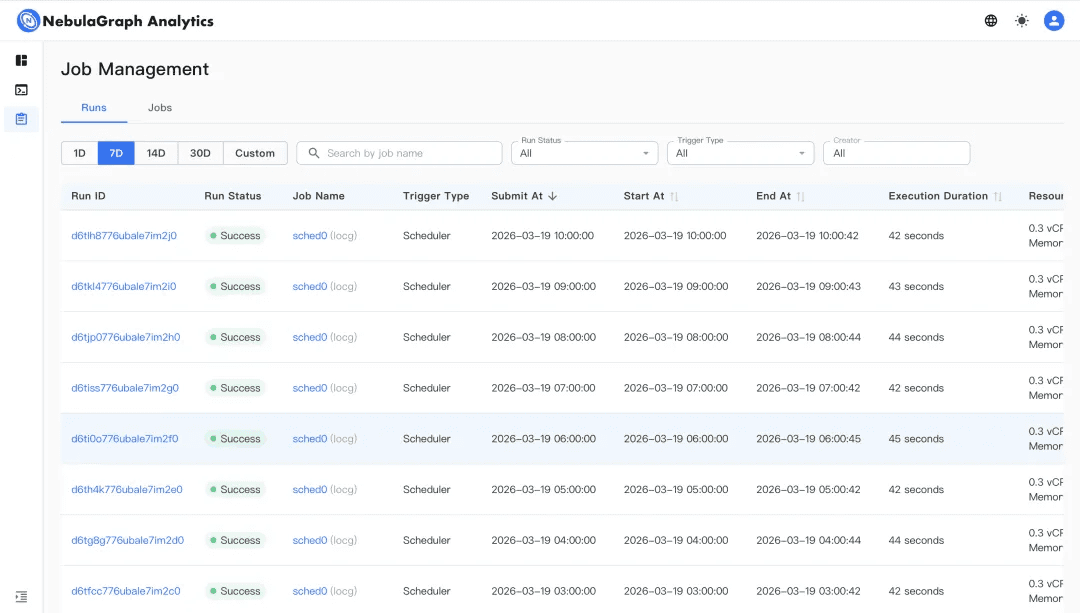
Track and Audit: A dedicated run records tab provides a detailed log of all job executions. You can filter by time range, job ID, status (e.g., success, failed), and trigger type, giving you full visibility and traceability into your analytics operations.
Real-World Application Scenarios
The flexibility and power of NebulaGraph Analytics make it applicable across a wide range of domains where relationships are the core of the business problem.
User and Customer Analytics: Understanding user value goes beyond simple transaction histories. It’s about understanding their position within the network of all users. NebulaGraph Analytics can identify key influencers, high-value communities, and the most effective propagation paths for information or campaigns, enabling hyper-targeted and effective engagement strategies.
Risk Control and Anti-Fraud: Fraud is inherently a network problem. NebulaGraph Analytics allows you to run sophisticated community detection and path analysis at a massive scale, shifting the paradigm from identifying isolated suspicious events to uncovering entire fraudulent ecosystems.
Financial Auditing and Anti-Money Laundering (AML): Tracing the flow of funds through complex, multi-layered transactions is a quintessential graph problem. With custom algorithms, financial analysts can model specific types of suspicious money trails, detect circular flows, and identify critical intermediary accounts that are central to laundering activities. This transforms an opaque, manual process into a structured, scalable, and auditable computational task.
Asset Management and Systemic Risk: In finance, understanding the hidden interconnections and contagion paths between assets, portfolios, and institutions is paramount. NebulaGraph analytics provides the framework to map these dependencies, model “what-if” scenarios for risk propagation, and identify systemic vulnerabilities that are invisible to traditional siloed analysis.
Conclusion: A Platform for the Era of Billion-Relation Analytics
As we enter an era where graphs routinely contain billions of relationships, the bottleneck for insight is no longer the ability to model connections but the ability to compute on them efficiently and intelligently. NebulaGraph Analytics is built to meet this challenge.
It moves beyond the limitations of traditional, resource-intensive graph processing engines, offering a platform where efficiency (consuming up to 80% less resources than alternatives while delivering 5-10x faster performance) meets extensibility (through GQL-based custom algorithms and AI-assisted development). It provides the integration needed to fit into complex, existing data ecosystems and the operational tools required for reliable, continuous production use.
By absorbing the technical complexity of distributed computing, NebulaGraph Analytics allows business experts, data scientists, and developers to focus on what matters most: translating business intent directly into computational results. It turns graph algorithms from a complex engineering project into a business-accessible, scalable, and indispensable part of your data infrastructure.
Ready to Put Your Graph Data to Work?
If you're ready to move beyond basic queries and start performing custom, complex analytics on your largest graph workloads, we invite you to explore NebulaGraph Analytics. Our team of experts is ready to help you understand how it can fit into your specific environment.
Contact us today to schedule a personalized demo and discuss your use case!
