Case Studies
Feb 11, 2026
How Envision Leverages NebulaGraph for a Smarter, More Resilient Energy Network
NebulaGraph
Envision is a global leader in energy technology, committed to being the "Net-Zero Technology Partner" for enterprises, governments, and institutions worldwide. From smart wind power and energy storage to its AIoT operating system, Envision manages a vast, complex network of global energy assets. To truly orchestrate these interconnected systems, Envision required a technological foundation that could accurately reflect and efficiently process these intrinsic, complex relationships. This is the core role played by NebulaGraph. By leveraging NebulaGraph, Envision has constructed a "Whole Grid Graph," transforming disparate devices, data, and business logic into a unified, intelligible network that can be analyzed in real time, providing a technological breakthrough for navigating the complexity of the future grid.
The Three Core Challenges of the New Power System
The rapid integration of renewable energy is making modern power systems more complex, dynamic, and unpredictable. While delivering cleaner energy, this transition introduces unprecedented operational challenges that traditional technological architectures struggle to meet.
1. Complex Relationship Analysis
Systems based on traditional relational databases are not designed to handle intricate, web-like relationships between entities. When performing grid topology analysis—such as identifying all downstream lines and customers affected by a substation fault—the system must execute numerous, time-consuming multi-table JOIN operations. As the grid scales, this computational approach quickly hits a performance bottleneck, making critical network state analysis slow and inadequate for real-time decision-making.
2. The Critical Need for Real-Time Computing
The state of new power systems fluctuates rapidly, making traditional minute-level state estimation obsolete. Modern grid management demands that core analyses—like state estimation and power flow calculation—sync with the data refresh rate of SCADA (Supervisory Control and Data Acquisition) systems, achieving second or even sub-second responsiveness. This places extreme performance demands on the underlying data platform's storage and computational capabilities.
3. Multi-Source Data Silos and Coordination Difficulties
Grid data is naturally scattered across different systems (SCADA, asset management, weather systems, etc.) and hierarchical levels (transmission, distribution), creating information "silos." The limited availability of real-time measurement data, particularly in distribution networks, makes it difficult to comprehensively and accurately characterize the entire grid's operational state, hindering advanced applications like transmission-distribution coordination.
The Envision Solution: A "Whole Grid Graph" Powered by NebulaGraph
To fundamentally address these challenges, Envision selected NebulaGraph as the core engine for its next-generation grid intelligence analytics platform. This solution is not a simple database replacement but a paradigm shift from a "table" to a "graph" mindset.
Building a Holistic "Source-Grid-Load-Storage" Graph Data Model
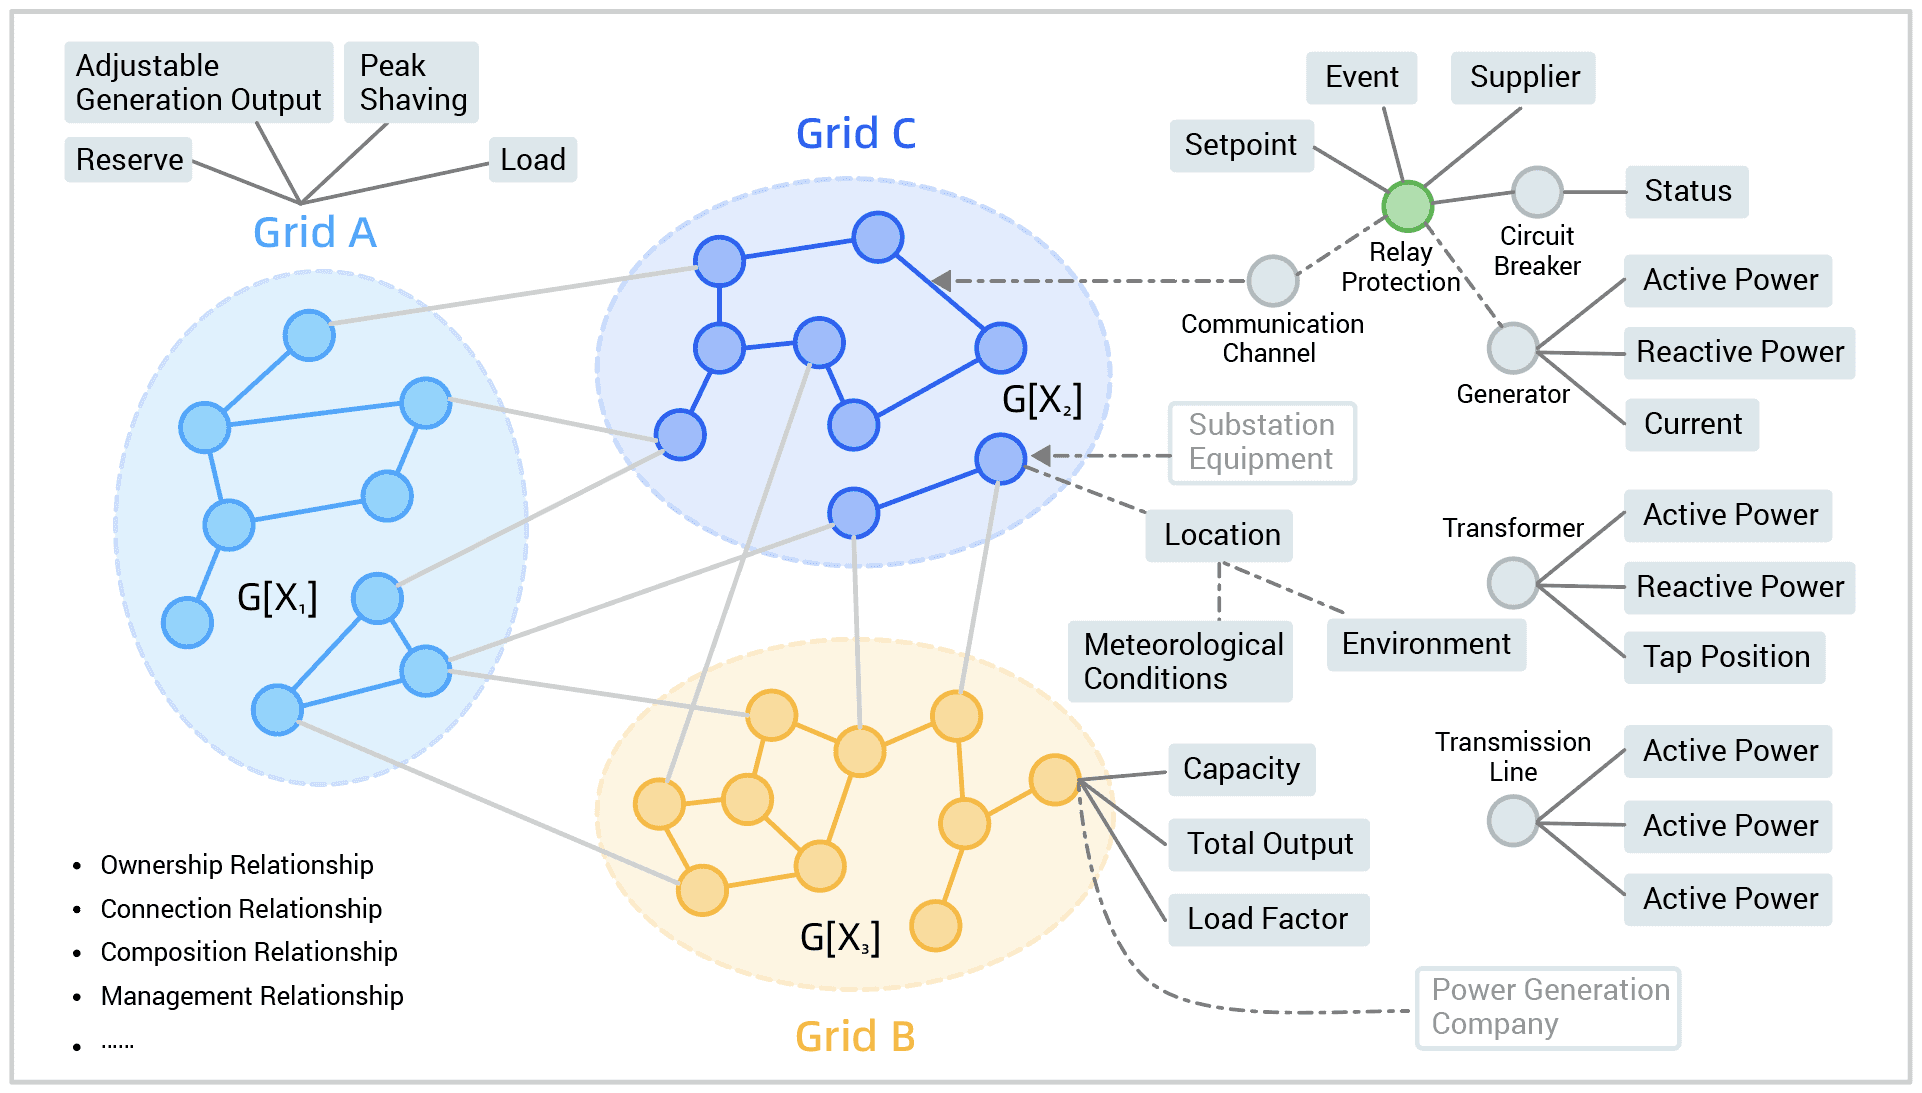
Using NebulaGraph, Envision constructed a spatiotemporal "Whole Grid Graph" data model, revolutionizing data organization:
Graph Modeling and Data Fusion
Every physical device (e.g., busbars, transformers, switches), organizational unit, and load in the generation, transmission, transformation, and distribution sectors is abstracted as a "vertex" in the graph database. The physical connections, electrical relationships, and ownership links between devices are abstracted as "edges." This model naturally fits the grid's topological structure. NebulaGraph stores these complex relationships with high efficiency and integrates SCADA real-time data, static model data (CIM/E), meteorological data, and more into this comprehensive graph, achieving complete data integration.
Automatic Topology Construction
Envision developed an automated conversion mechanism that transforms traditional power system relational data models into graph models within NebulaGraph, ensuring the accuracy and dynamic update capability of the grid topology.
A High-Performance "Storage-Compute Integration" Graph Analytics Engine
NebulaGraph's "storage-compute integration" architecture is key to achieving ultra-real-time analytics. Computations are executed close to where the data is stored, drastically reducing the I/O overhead associated with data movement. Furthermore, NebulaGraph fully leverages the node/layer parallel computing characteristics unique to graph analytics, combined with numerous specialized power algorithm modules developed by Envision, to push computational performance to its limits.
Application Outcomes: Achieving Sub-Second Ultra-Real-Time Perception
The solution based on NebulaGraph has enabled Envision to achieve a leapfrog performance breakthrough in core grid analytics, reaching an "ultra-real-time" perception level unattainable by traditional architectures.
Application Scenario | Traditional Solution Latency | NebulaGraph-Based Latency | Performance Improvement |
State Estimation / Online Power Flow Calculation | Minutes | Milliseconds to Subseconds | Synchronizes with SCADA's second-scale data refresh |
Real-Time Dynamic Topology Analysis | Tens of seconds to minutes | Under 1 second (for 10k+ node systems) | Instant visualization of topology changes |
N-1/N-2 Contingency Analysis | Hours | Seconds for hundreds of scenarios | Rapid identification of system potential risks |
Core Breakthroughs
Leap in Steady-State Analysis Performance
Leveraging NebulaGraph's efficient parallel computing, the Envision platform has, for the first time, achieved complete steady-state analysis—including state estimation and online power flow—for large grids with tens of thousands of nodes within a single SCADA sampling cycle (seconds), compressing core analysis latency from minutes down to milliseconds.
Spatiotemporal Evolution Graph Acceleration Mechanism
This is an innovative application by Envision. By utilizing NebulaGraph's flexible modeling capabilities to construct "Temporal Evolution Graphs" and "Spatial Evolution Graphs," the platform maximizes the reuse of intermediate computational results. This mechanism boosts the speed of real-time operational state analysis by 15-20 times and improves the speed of N-1 contingency analysis by over 10 times.
Conclusion: Graph Technology Is the Foundation for the Future Smart Grid
Envision's practice clearly demonstrates that addressing the complexity and real-time demands of new power systems requires fundamental innovation at the data architecture level. The NebulaGraph database, with its efficient storage of complex relationships, sub-second real-time traversal queries, and excellent horizontal scalability, proves to be the ideal technological choice for building a "Whole Grid Graph" and achieving ultra-real-time situational awareness.
It empowers grid dispatchers to perceive the state of the entire network with unprecedented speed and precision, proactively predict risks, and optimize operational strategies, thereby significantly enhancing grid reliability, security, and its capacity to integrate high proportions of renewable energy.
The future core competency of energy systems will largely depend on the ability to understand and manage complex network data. Whether you are in the power industry or facing similar challenges in complex system management, risk control relationship networks, or real-time recommendations, NebulaGraph could offer you a transformative solution.
Visit the NebulaGraph website to explore technical details and more industry case studies.
Contact our Solutions Team to discuss your specific scenario and co-create your own "Intelligent Network Graph."
Master complexity by starting with understanding connections. Let NebulaGraph help you unlock the deep relational value of your data and drive the future of intelligent decision-making!
