Use-cases
Graph Database Evaluation | Why 360 DigiTech Migrates from JanusGraph to NebulaGraph
This is the transcript of the presentation by Zhou Peng from 360 DigiTech at nMeetup@Shenzhen about their practice of various graph database solutions. Watch the video on YouTube.

Hi everyone. I would like to begin this sharing with the introduction to the company I am currently working for. You may not be so familiar with the company name, 360 DigiTech. It used to be called 360 Finance. Since this year, we have shifted our focus to digital technology, so our brand was changed to 360 DigiTech. Our core product is a digital line of credit (360借条). You may have seen its ads when you watch short videos on the Douyin or Toutiao App.
As you can see, our core business is lending, both to individuals and to micro and small businesses. Besides, we have many enhancement businesses. Because we give money directly to our customers, we have high requirements for anti-fraud when developing applications. NebulaGraph has been used in our production environment, but not for research only. Therefore, we have very high requirements for the availability and data carrying capacity of NebulaGraph.
Here I would also like to share how I got involved with NebulaGraph.
Before NebulaGraph, JanusGraph was used in our production environment. At that moment, it caused many performance bottlenecks of our system. One is that its query performance deteriorated tremendously when the data volume grew. Another one that hurt us very much was that vertices and their properties were stored separately in JanusGraph. For example, we want to filter data by property. In an example graph, a person was connected with 1,000 persons. If we wanted to find the persons who were older than 30, with JanusGraph, we had to do the query in batches or one by one, because it did not enable us to filter vertices by age in the process of retrieving the 1,000 vertices. This was why we were always looking for an alternative to JanusGraph. Coincidentally, I met Sherman, co-creator of NebulaGraph. Later, Sherman and Wu Min came to our office to give us a technical sharing. During the communication, we specifically asked him about our second pain point and he gave us a satisfactory solution based-on the architecture of NebulaGraph, which I believed could definitely solve our problem. Then we initiated PoC. Together with the NebulaGraph team, we verified the possibility of applying NebulaGraph in our production environment. The solution was finally deployed in our production environment within a few months. During the PoC phase, we were impressed by their excellent service.

My presentation today covers four topics. The first one is why we need a graph database.

The second one is about the graph database solutions through the iteration of our application. We started with AgensGraph. Maybe not everyone has heard of that. JanusGraph was used in the third version of our application. And now, NebulaGraph is used in our production environment.

So far, there have been about two billion vertices, which was the amount of data when we imported it a few days ago and is probably larger now, and 20 billion edges, with three replicas, in our production environment. Including the vertex and edge properties, the data volume is about 7 TB. We used the graph database for business warnings inside 360 DigiTech, which have enabled us to detect 940 thousand risk points and about 910 thousand communities.
Earlier, the big shots from the Tencent Security team talked about community detection. It is what we are strongly in need of. Why? We found that gangs have been involved in some underground economy crimes. When people apply for a loan on our platform, we need to be able to detect the fraudulent gangs, which means our Apps must have anti-fraud capabilities. How? Generally, through the devices that the gangs are using and the WiFi usage, we can do that. Currently, based on these rules, we have detected about 910 communities, in which we targeted a head community, followed the links, and then found that it was a pyramid scheme with a very large number of members. Finally, we took outright dismissal or other anti-fraud measures against their borrowings, thus avoiding a large financial loss.

The anti-fraud scenarios inside 360 DigiTech can be grouped into these categories.
The first one is group relationship analysis. Simply put, it is to analyze the relationships among a group of people. We need to know how they get related, for example, via WiFi devices or other relationships.
The second one is warning for risk points. For example, when a user who has just been granted credit applies for a loan and a warning is triggered, it means that this vertex may be very risky and related to other confirmed risk points.
The third one is detection of risky communities. We found that gangs have been involved in some underground economy crimes. When people apply for a loan on our platform, we need to be able to detect the fraudulent gangs, which means our Apps must have anti-fraud capabilities. Generally, through the devices that the gangs are using and the WiFi usage, we can do that. So far, based on these rules, we detected about 910 communities.
The fourth one is query of customer relationship network, to detect the high-risk suspicious users. For example, I kind of suspected a user but I was not very sure, so I checked his relationship network in our real-time production environment, such as whether he or she was associated with some risk points and what the relationships are.
Finally, we need a relatively large amount of statistics, that is, we need to know the statistical variables associated with the one-hop and two-hop relationships. For example, how many persons are one-hop and two-hop associated with a person and how many persons are associated between the person and the confirmed risk points. This is a multi-dimensional dataset. So far, we have had about 30 or 40 related variables.

The preceding figure shows a graph in our production environment. As long as I have some information about a user, I can directly find out his or her relationships with others. The vertices of different colors in the graph represent entities of different status. For example, the peach-colored vertices represent risky points, the yellow ones represent suspiciously risky points, indicating that they are not yet real risks, and the gray ones represent the points that have no special effect on the others in the graph.

The preceding figure shows a real risky community. You can see in the center of the graph there is a vertex with the WiFi icon. It indicates that the relationships between users in this community are generated through the same WiFi.
Through the status of vertex properties, we can determine the distribution of users who have been granted credit and have borrowed money on the 360 Borrowing (360借钱) App. Based on this distribution, we can well detect the fraudulent gangs. Currently, we have found many relationships by using these graphs and this is just a typical case.

Now, I will introduce the practice of AgensGraph in our application. AgensGraph is the first graph database solution we used. If you have used it, you know that it is based on PostgreSQL, which means it is actually based on a relational database. It provides some features of a graph database by applying a shell to a relational database.

The data volume inside 360 DigiTech is relatively large and each vertex has many properties. This was why in the architecture we stored the core properties in the graph and the full amount of properties in HBase.
Therefore, when we queried to find a relationship, we first searched for it in a graph, and if we wanted to know further information after it was found, we had to go to HBase. In fact, it was unavoidable, because if we stored all the data in a graph, a very large storage space would be occupied and the query performance would be deteriorated. Our solution was just a compromise. In addition, the AgensGraph cluster, with about four standbys, was deployed on servers of high configuration. In the later stage, we just could not afford more such servers.
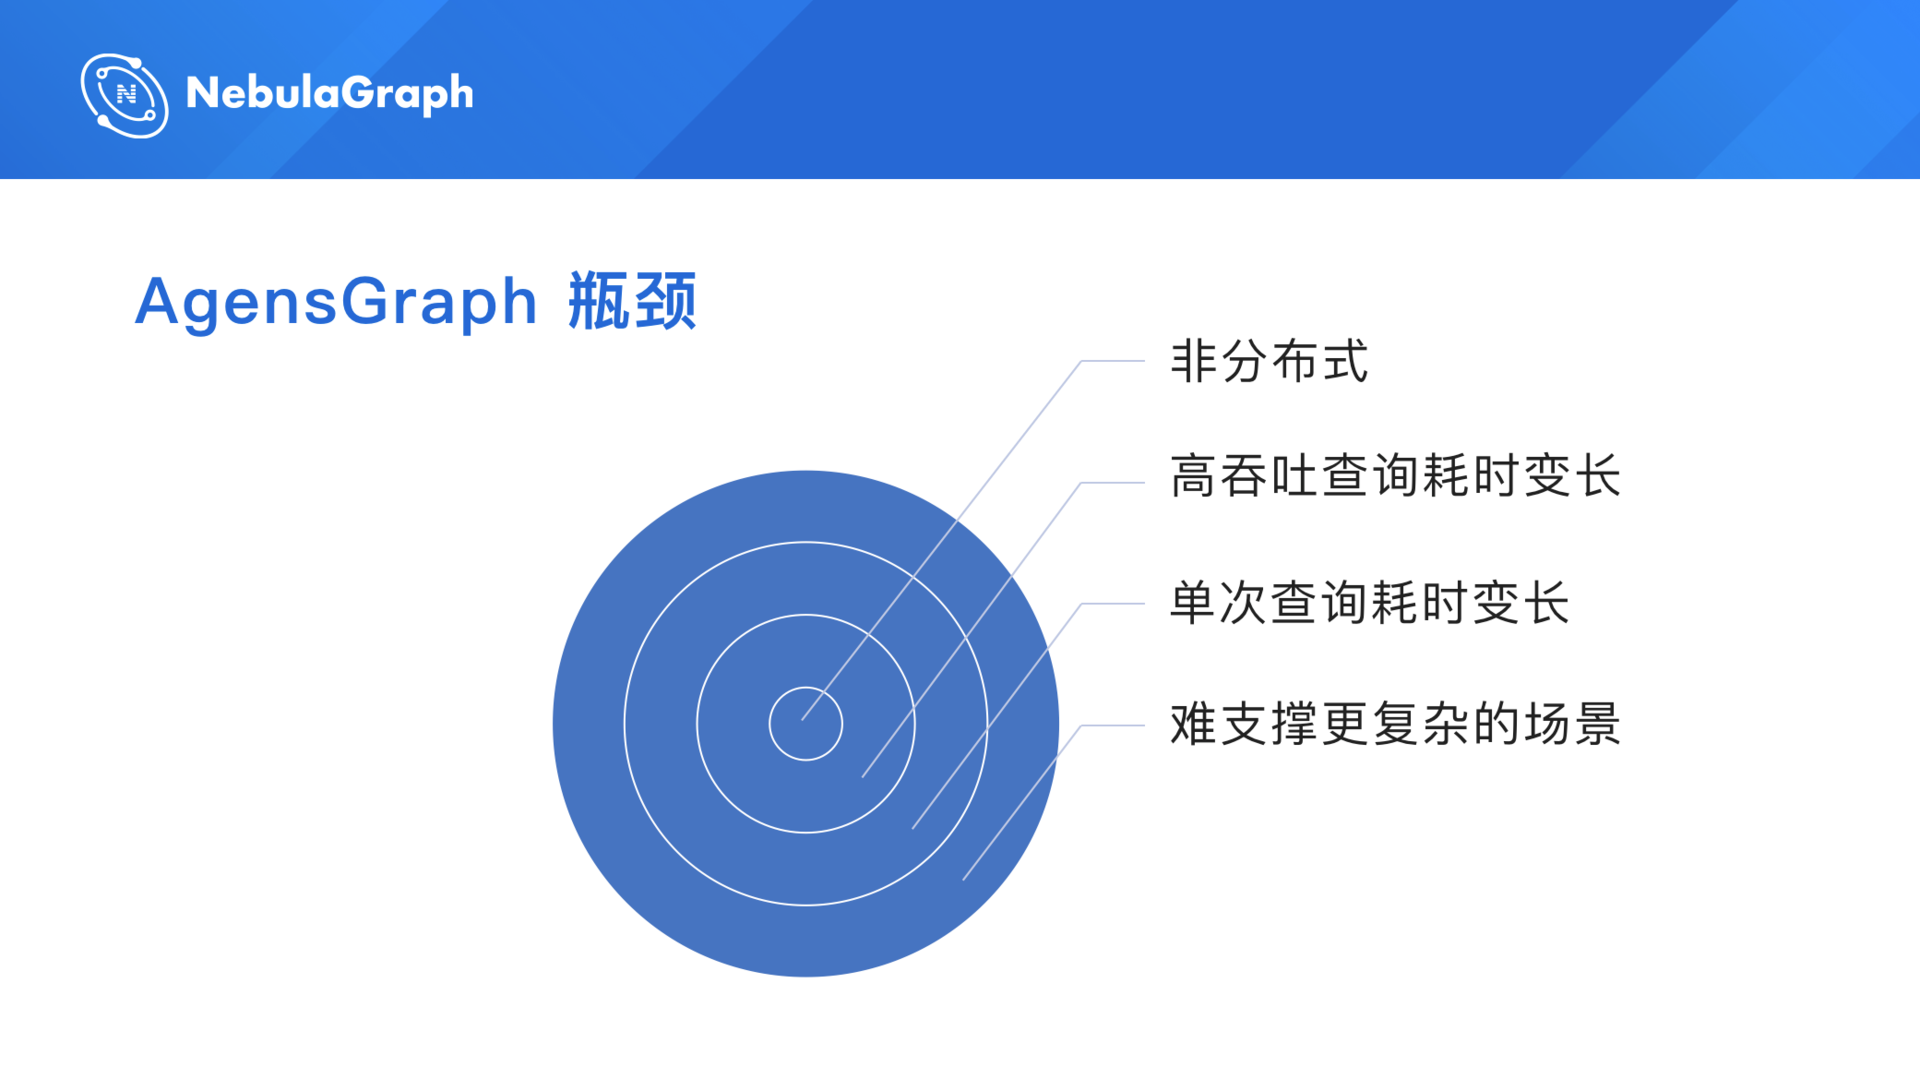
Here are some bottlenecks in the AgensGraph solution. The major one is that its architecture is not distributed, which means all data must be stored in a single node. However, the storage capacity of one disk was not enough for all the amount of our data. The storage capacity of the server we purchased was 4 TB, but our data volume was already larger than 4 TB, so one server could not store it all. We had no choice but explored for a distributed solution. When the volume of data stored in a disk was large, high throughput queries consumed more time. To store such a large volume of data, even though it was divided and stored in many disks, the bottleneck still existed. Too large data volume on a single disk led to more time consumed for a single query, which directly affected the business approval process. For example, if you applied for a loan, according to our service promise, the feedback must be given in a few minutes. However, we need to run many procedures, which may cause a single query to take too long, so you might wait more time and the experience would become worse. The last point is that AgensGraph cannot support more complex scenarios. Because only the core properties are stored in the graph, if we want to do more explorations and query more relationships, we cannot retrieve them. AgensGraph cannot connect seamlessly to HBase, so we need to do further queries. Because of all these problems in using AgensGraph, we started to look for its alternative.

Then we started to migrate the graph data to JanusGraph. Why I added "Pains" (痛) in the slide title? Because in the field of distributed graph database solutions, no one was good at that time. We did a research on TigerGraph, and its team members came to 360 DigiTech and communicated with us. If you know it, you should know that it is mainly designed for AP analysis, but not for TP scenarios, so we discarded TigerGraph. Finally, we chose JanusGraph, which looked pretty good at that time.

But when we started using JanusGraph, we encountered a lot of problems. The preceding figure shows the architecture of JanusGraph. Its main problem is that its storage is based on HBase, but not self-developed, so when we used it in our production environment, we had to use HBase as the underlying layer, which caused many pitfalls later. I will talk about why such a design causes so many pitfalls.

The first pain that comes with using JanusGraph occurred in the process of importing data. It was very painful.
At the bottom of the preceding slide, there is a link to an article I wrote on JanusGraph titled "Migration of tens of billions of graph data into JanusGraph" (Only Chinese version available). Until recently, some readers still sent emails asking me how this problem was solved and I replied "We abandoned JanusGraph and are using NebulaGraph". Why did I write this article? Because when I was trying to migrate the data into JanusGraph, there were not many articles in Chinese about such a practice on the Internet and I had to read the commits of the JanusGraph project to get what I needed, which was very painful. Therefore, I wrote this article. I hoped it would be of some help to the developers in China. This article has had a number of visits, which looks good in the field of graph database solutions.
Let me explain why importing data with Spark is such a pain. The solution I was considering was to import the vertices and edges separately, that is, import the vertices first and then the edges. This raised a problem. The IDs of our vertices were generated automatically. If we imported the vertices that have only business-related properties, how could I get their vertex IDs? It's troublesome. For example, to insert an edge, I had to do a query to retrieve the vertex IDs. This was easy if the data volume was small. However, you know, we had more than 20 billion edges. We did the math. It would take two to three years to finish the data import. Then, we came up with a solution. In fact, JanusGraph provides a feature called Bulk Loading, but it requires a really weird data format. Why do I call it "weird"? In the format, the first column represents the vertex IDs, and the particular row (other entries except the first column) represents all the incoming and outgoing edges associated with the vertex. Can you get it? For example, to import 10 thousand vertices, I would have 10 thousand rows of unique IDs with all their associated edges in the file, which means I must import all edges together with the vertices.
Therefore, we used a special Spark operation called Code Loop, which can be used to combine vertices and edges. We did a lot of work to convert the data into the required format. After the conversion, we started importing the data into JanusGraph. The process of data import was even more painful, because whenever a failure occurred in the process, we had to start over.
Can you imagine that? With such a large amount of data, it was impossible to complete the import process quickly. In fact, it took us a whole day, that is, 24 hours. There was another problem. The data import operation put a lot of pressure on the cluster, because some timeouts and exceptions occurred frequently. We had to retry several times to complete the import. To solve these problems, we made various adjustments to Spark parameters. Finally, we finished the data import at around 11:00 or 12:00 pm one night. At that time, we all wanted to go out for a midnight snack to celebrate that we are finally out of the suffering.
After the data import, we started querying data, which was another huge pitfall. In the previous example, I got 1,000 adjacent vertices to a vertex, and I wanted to filter these vertices by property. For example, how could I find the vertices that were older than 30? I needed to filter these vertices, right? Do you know what the default query mechanism in JanusGraph? Query one by one. Can you believe that? To filter 1,000 adjacent vertices, I had to perform 1,000 queries? The version I used does not support what I needed. However, I looked in their community and found a parameter, _multiPreFetch, which supports querying 1,000 vertices in batch. It was a new feature in Version 0.4. It made JanusGraph a better product. At least it solved part of the problems. But it does not support data pushdown. How about NebulaGraph? When the 1,000 adjacent vertices are scanned, they are not returned directly as the result. Because the properties and vertices are stored together, they are filtered directly and then only the filtered vertices, maybe only 100 vertices, are returned as the result. It is very fast and the data consumption (I/O operations) is very small. Therefore, I commented in the JanusGraph community that without the _multiPreFetch parameter, JanusGraph is impossible to be used in a production environment because no one performs queries one by one. The performance is too low.
Here came the third problem: In JanusGraph, queries cannot be pushed down.
Back to the JanusGraph architecture. Its storage is based on HBase, but not self-developed, which means that it cannot push down these queries and filtering conditions to the storage layer, so it must return all the associated data to its Server side and then filter them one by one in memory. What a waste of IO consumption and time it is!
The fourth pain. It continued until we migrated data to NebulaGraph. Why was it so painful? Because we have such a large amount of data that there are bound to be some super vertices. For example, some default WiFi devices and other devices may be associated with millions of vertices. Such devices are the super vertices in a graph. If you accidentally query such a vertex online, do you know what the consequences will be? Both the cluster and HBase will directly crash. To solve this problem, we had done a lot of optimizations, exerted a lot of limits, and tried various restrictions, but did not completely solve the problem. The main cause is that its storage does not support query pushdown. Filtering data cannot be performed in HBase, which is very troublesome.
Later, I will introduce how NebulaGraph solved this problem very well.

With JanusGraph out of the way, let's move on to NebulaGraph.
The following figures show a comparison between JanusGraph and NebulaGraph. This is the first one.

And this is the other one.

In the preceding figures, the chart above shows the comparison of networking IO consumption and the one below shows the comparison of Disk IO consumption.
You can guess which figure shows the performance of JanusGraph. That's easy. The first one. At that time, we used 20 high-configuration servers with SSDs to deploy the HBase cluster in the production environment. Why did these lines not overlap exactly? Because the NICs of some servers have been upgraded from 1-Gigabit to 10-Gigabit, the maximum values are different. As for the disk performance, you can see from the chart that the disk and IO are fully occupied during the peak periods.
Now, let's see the charts of NebulaGraph. During the peak periods, the networking IO consumption decreased dramatically, and the disk IO consumption was also low. To make the performance comparison clearer, you should know that we used only six servers to deploy the NebulaGraph cluster for such a large amount of data, but 20 servers with SSDs were used to deploy the HBase cluster for the JanusGraph solution, excluding the six servers for the deployment of Gremlin Server. That is why I thank the NebulaGraph community. They save us a lot of money on resources. You know, a highly configured server cost more than 10 thousand RMB.
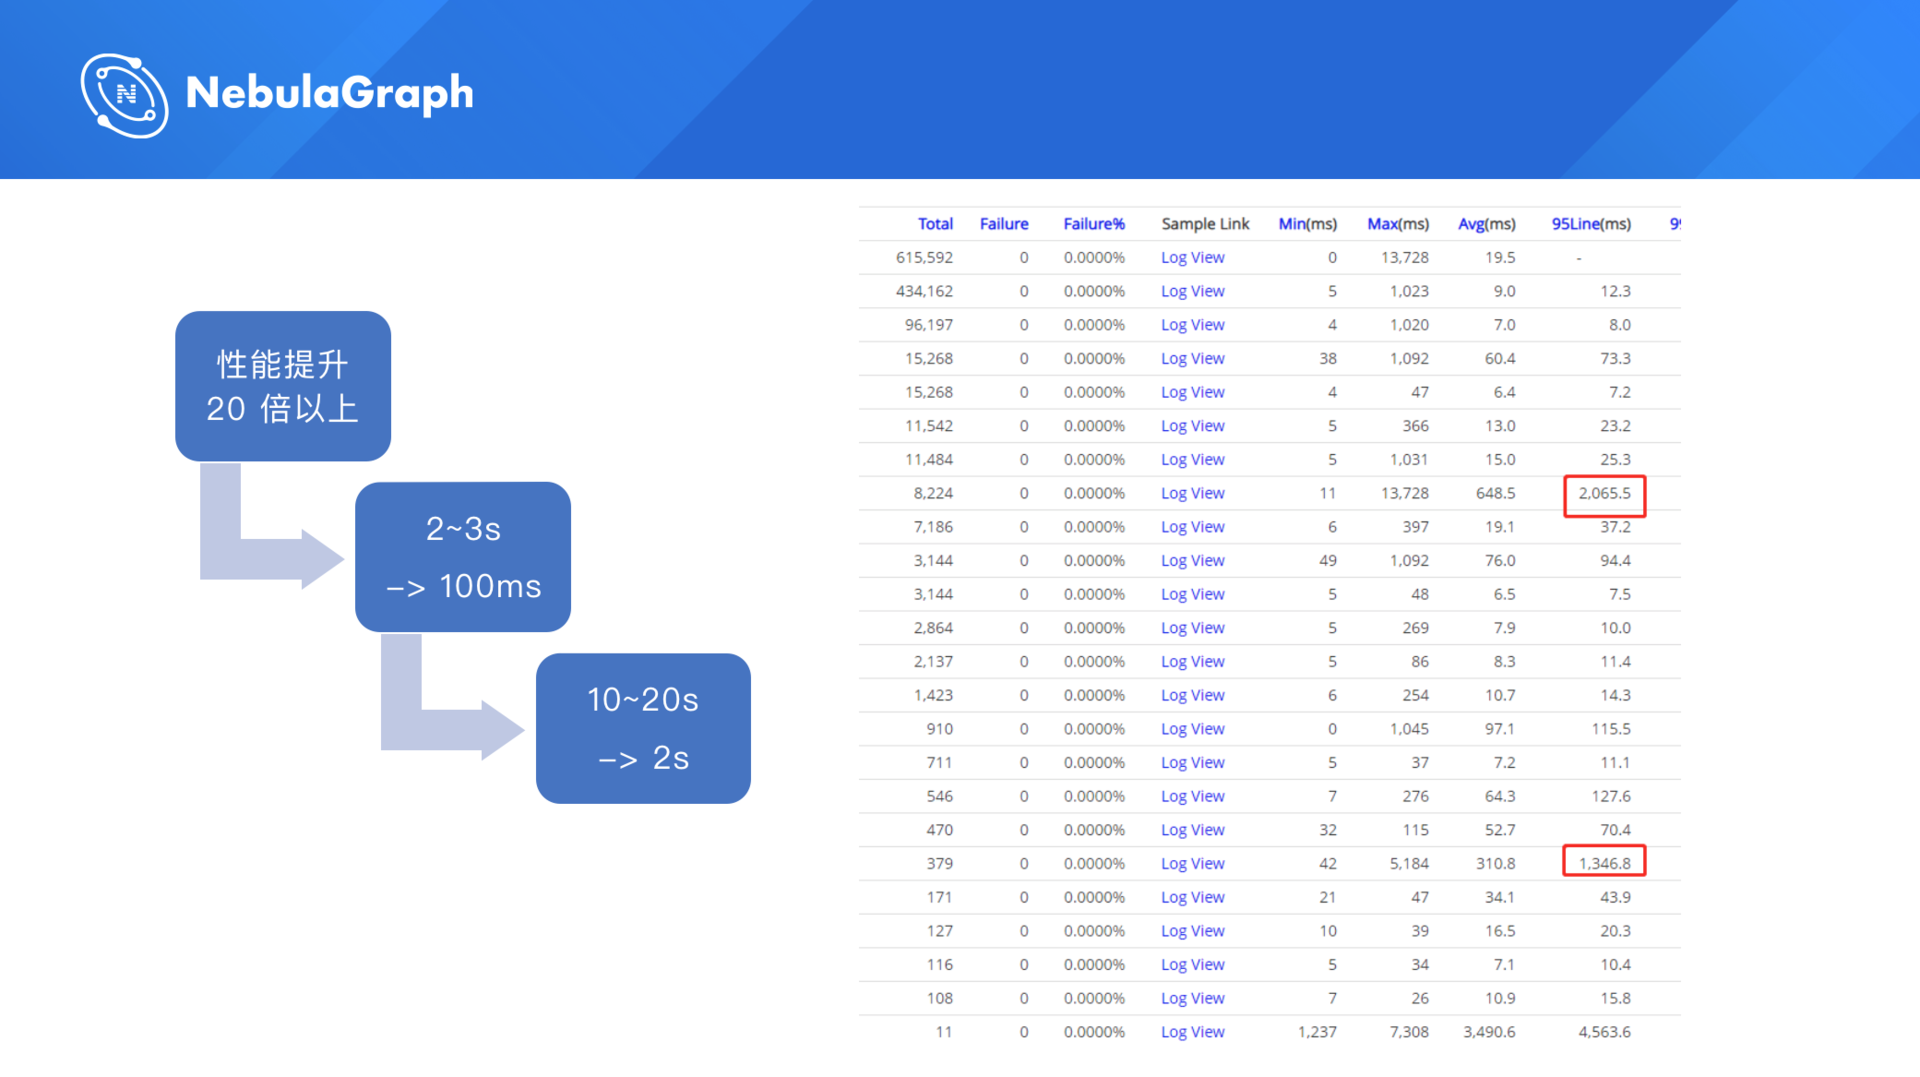
The preceding figure shows a log in our production environment. The left shows the time consumed for CAT. There are no statistics of JanusGraph, so you cannot see the comparison. On the slide, I have given how much the performance is improved: Compared with JanusGraph, NebulaGraph can improve the query performance by more than 20 times; in a complex business case, a query that needs 2 seconds or 10 seconds in JanusGraph can be completed in 100 milliseconds or 2 seconds in NebulaGraph. For online applications, the optimization of the query performance is significant, which means that the time consumed in queries is very short.
You can see the time consumption in NebulaGraph. For the most complex scenario, that is, the computation of the risk variables for two-hop relationships, it takes only two seconds in NebulaGraph, while 20 seconds are needed in JanusGraph.

The preceding figure shows a parameter, max_edge_returned_per_vertex. Why do I need to introduce it? It is a parameter of the storage engine of NebulaGraph. It is used to set the maximum number of edges returned with each vertex. Which of our previous pain points do you think this parameter can solve? Yes, the super vertex one. Since we started using this parameter in our production environment, we do not have to be woken up in the midnight to perform the maintenance operations.
At the bottom of the preceding slide, I provide a link. It is an article I wrote titled "Migrate Data from JanusGraph to NebulaGraph". This article describes the process we went through the migration and some problems we encountered. As what I mentioned, the graph database maintainers like this parameter very much, because it really means no more waking up in the middle of the night with a phone call to perform maintenance. Therefore, we are very grateful to the NebulaGraph team for designing such a thoughtful parameter. I do not think it would have occurred to anyone who is not a veteran of the industry, would it?
This is all the sharing of Zhou Peng from 360 DigiTech. Thanks.

Join the NebulaGraph Slack channel and talk to the community!