
NebulaGraph Studio
Manage your graph database graphically
NebulaGraph Studio is a web-based visualization tool for graph databases. It works together with NebulaGraph DBMS and provides one-stop services such as creating graph schemas, importing data, writing nGQL queries, and exploring graph data.
Features
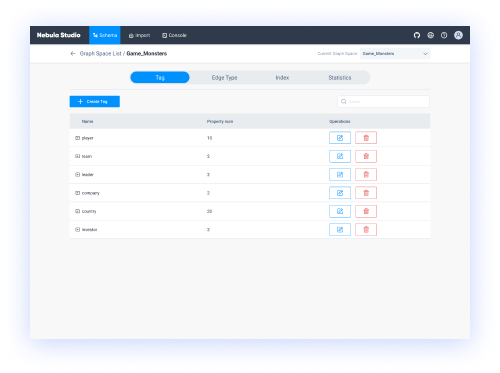
- Manage your schemas with a graphical user interface. It'll help you quickly get started with NebulaGraph.
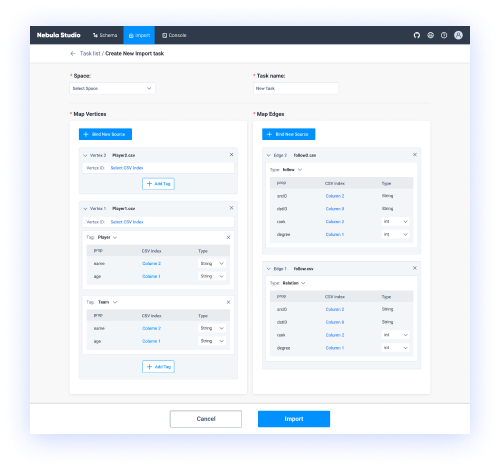
- Operate batch imports of vertex and edge data with clicks, and view a real-time import log.
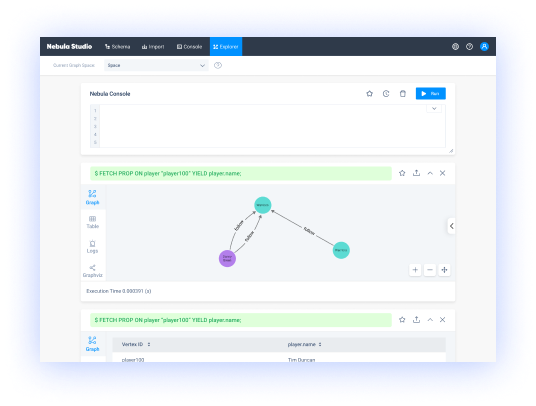
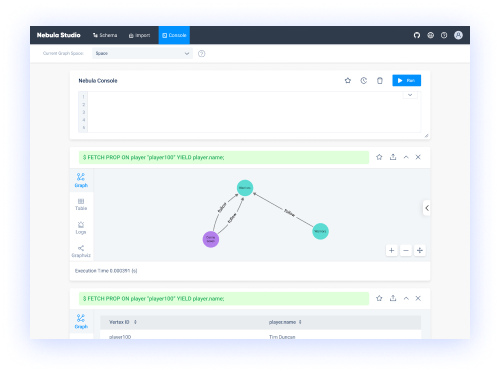
- Run nGQL queries and read the results in an intuitive way.
Why NebulaGraph Studio?
Get a 360° view of your NebulaGraph cluster
You have a dataset, and you want to explore and analyze data in a visualized way. You can use Docker Compose to deploy NebulaGraph and then use Studio to explore or analyze data in a visualized way.
You need log information about system failures once they occur.
You are a beginner of nGQL (NebulaGraph Query Language) and you prefer to use a GUI rather than a command-line interface (CLI) to learn the language.
You have deployed NebulaGraph and imported a dataset. You want to use a GUI to run nGQL statements or explore and analyze graph data in a visualized way.
