
NebulaGraph Dashboard
Your window into NebulaGraph clusters
NebulaGraph Dashboard is a free and open panel that helps DBAs and Ops navigate and monitor their NebulaGraph services and clusters in an intuitive way. It does everything from displaying performance metrics of machines and services to visualizing cluster health.
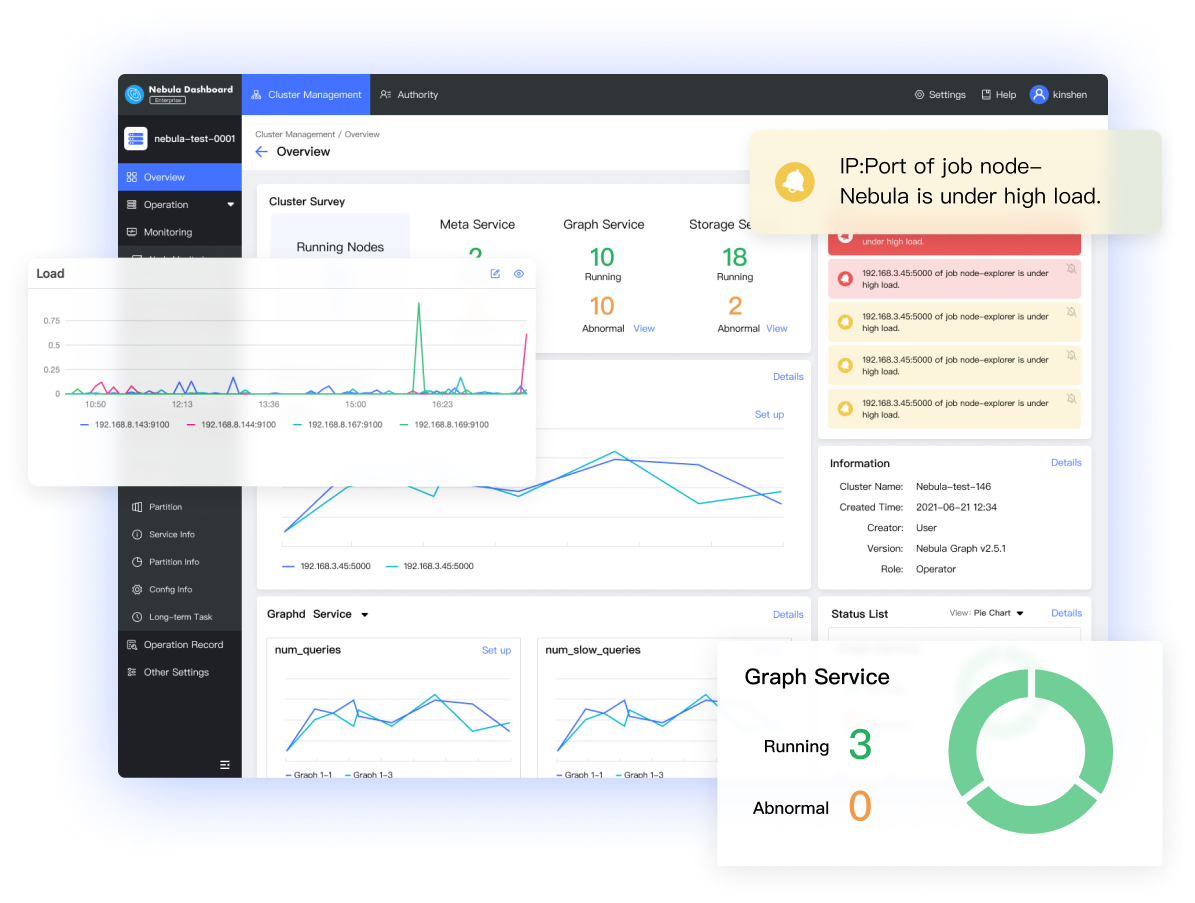
See your cluster health at a glance
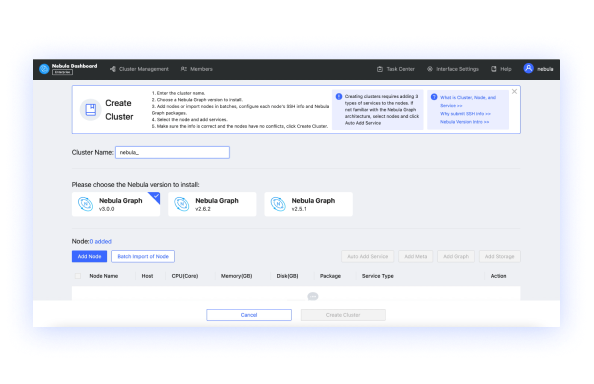
- Select how many nodes you need for each Nebula Graph service and the storage space you need to store your data.
- Deploy a Nebula Graph cluster in the cloud based on your needs in a few clicks.
- Upload and explore your graph data using our built-in visualization tools.
Features
What is NebulaGraph Dashboard
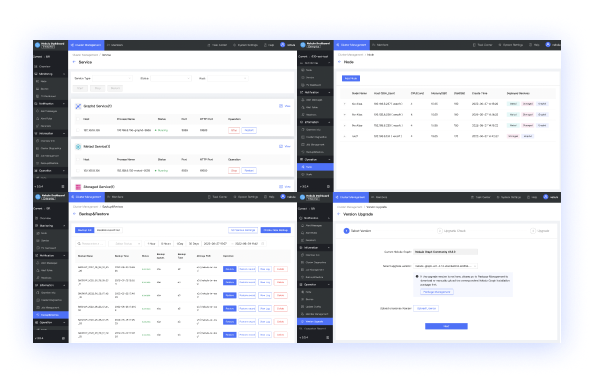
The one dashboard to rule them all
- Create a NebulaGraph cluster of a specified version, import nodes in batches, scale up NebulaGraph services with one click Start, stop, and restart services on the visualized user interface Delete and unbind NebulaGraph clusters
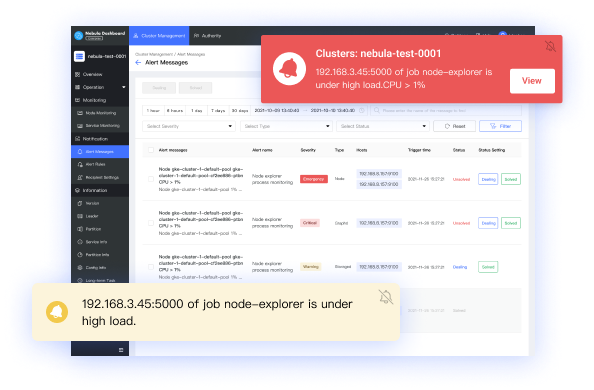
Be informed. Be alerted.
- Set up customized alert rules or use built-in rules View alert messages Send alert notifications via email, webhook, etc. Get Emergency-level alert notifications on any page in NebulaGraph Dashboard
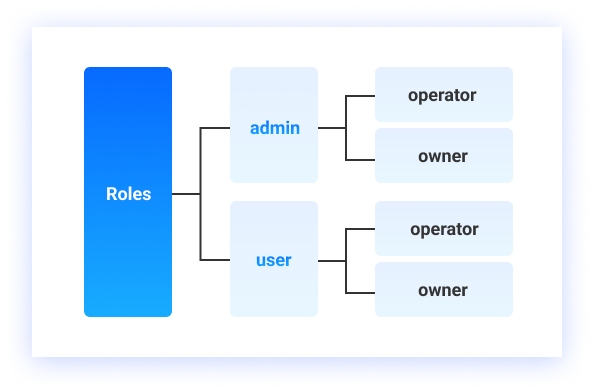
Fine-grained access control
- Support LDAP user authentication Use role-based access control to invite users into certain spaces, and give them access to specific content and features. Privilege distinction and cluster isolation
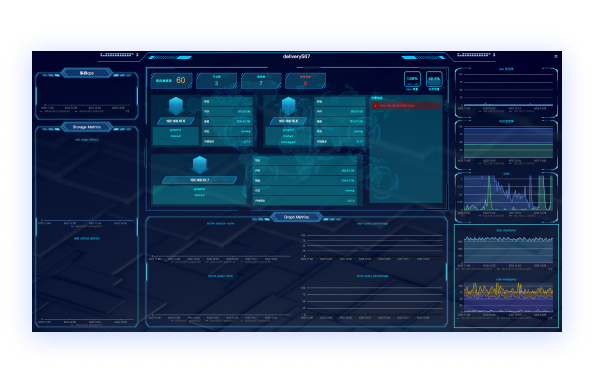
Get a 360° view of your NebulaGraph cluster
- Monitor your graph database cluster health, alert messages, and key indicators in a Dashboard TV
One-click DevOps
- Starting or stopping instances or services with one click, simplifying cluster upgrade, scale in/out, backup and restore, and data balance.
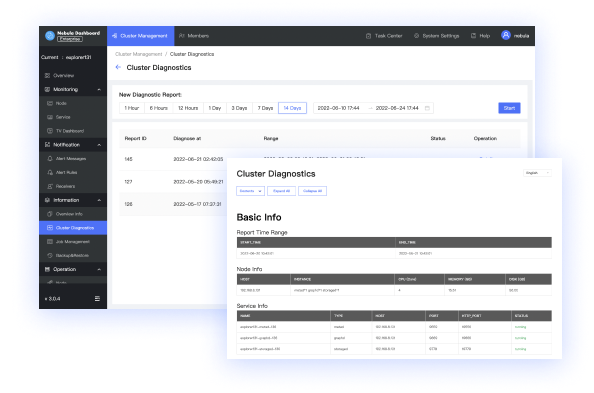
Enhanced diagnosis
- Generate diagnosis reports in one click, quickly locating and analyzing cluster issues in a specific timeframe. Diagnosis reports also help you understand basic information about nodes and services in a cluster and make DevOps suggestions or alerts based on the reports.
Why NebulaGraph Dashboard?
Advantages
You need to quickly find neighbor relationships from complex relationships, analyze suspicious targets, and display graph data in a visualized manner.
You need to filter, analyze, and explore a large data set in a visualized way.
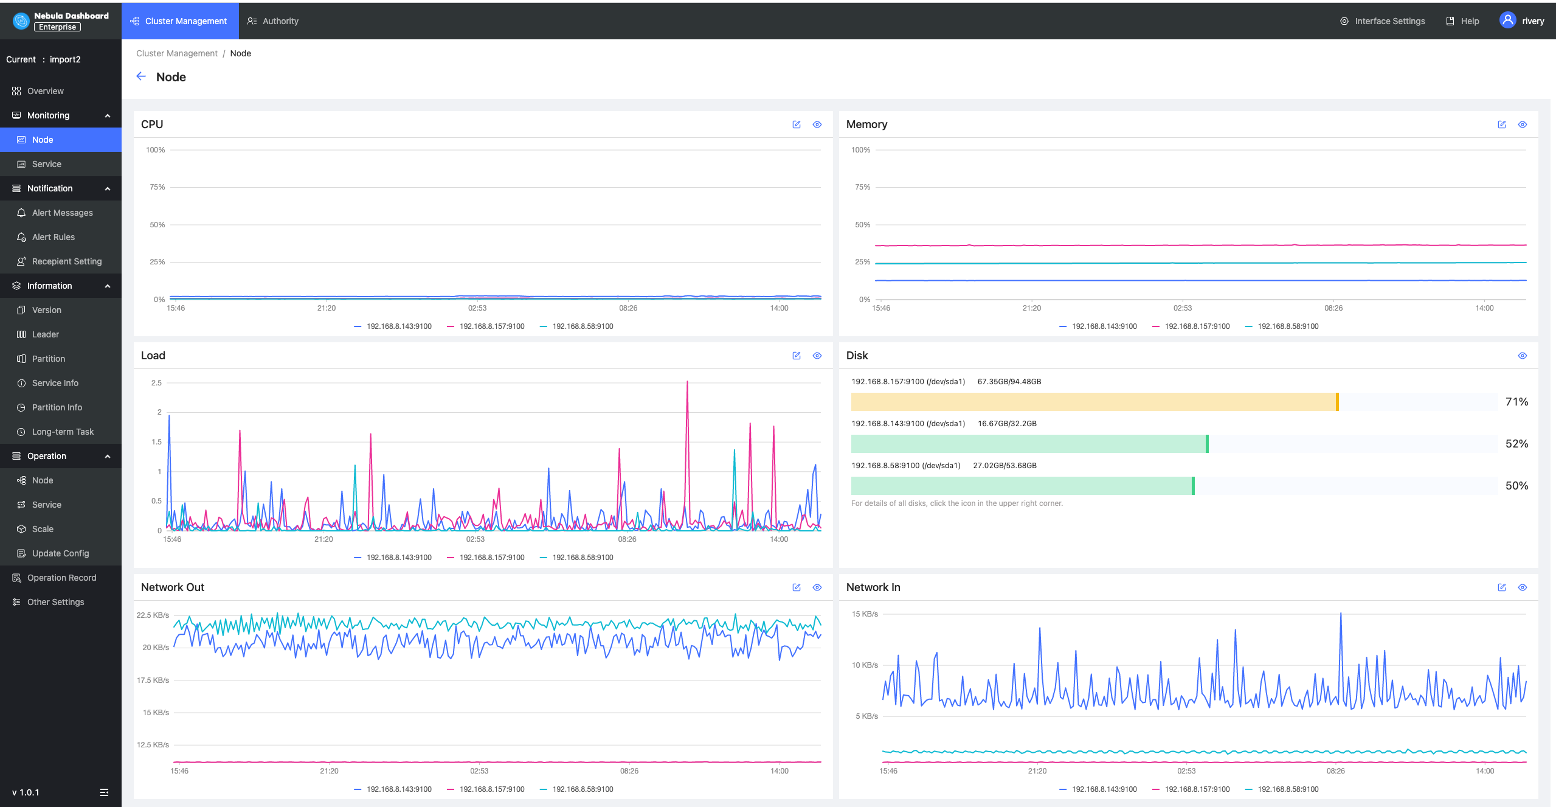
You need to monitor Nebula clusters from different aspects such as time, aggregate rules, and key metrics.
You need log information about system failures once they occur.
Version Comparison
Community Edition v.s Enterprise Edition
Community Edition
Monitor the status of cluster hosts
Monitor the information of cluster services
Monitor the information of the cluster
Enterprise Subscription
Full life cycle management for Nebula Graph clusters
Single cluster information monitoring
Multi-dimensional metrics monitoring
Real-time alert notification
Task center
Privilege & role management
Compare Plans
NebulaGraph Dashboard
CommunityContact Us
Monitoring
Cluster Monitor


Node Monitor
Service Monitor
Visualization Large Screen Display
Operation
Cluster Management
Node Management
Service Management
Job Management
Scale in/out
Cluster Version Upgrade
Backup and Restore
Log
Runtime Log
Audit Log
Analytics
Slow Query
Cluster Diagnosis
Notification
Alert Information
Alert Rules
Alert Notification Configuration
Authority
Multi-tenancy Management
LDAP Authentication
Authority Management
OAuth2.0 Authentication
Security
Operation Record
Video Demonstration
Ready to get started?
