Knowledge Graphs
Jun 2, 2022
Fraud detection using knowledge graph: How to detect and visualize fraudulent activities
Nick Russell
Fraud detection is important to any organization, be it a financial service or simply a web service. With the increase in technology and the ease of information being shared with other parties, traditional methods of fraud detection have been rendered obsolete. In this post, we will be looking into fraud detection using knowledge graph and how you could use graph databases like NebulaGraph to build a quality knowledge graph for fraud detection.
The main goal of fraud detection is to minimize losses and prevent further damage. In order to achieve this goal, we need to understand the nature of fraud and how it affects our business processes.
For instance, in case of credit card fraud, there are many cases where the criminals use stolen data to buy high-end products such as luxury cars, jewelry, and so on. As a result of this, banks have to pay heavy fines for these transactions and sometimes even lose their license due to their negligence in maintaining customers’ information securely.
In order to deal with this problem, banks use a variety of techniques such as machine learning, neural networks and artificial intelligence techniques to detect credit card frauds. However, these approaches have some limitations because these techniques rely on statistical models which can be easily fooled by hackers using synthetic data sets or through other methods known as adversarial attacks.
Graph database for fraud detection: How to detect and visualize fraudulent activities using knowledge graph
Knowledge graph is a state of the art of fraud detection. The reason is that it contains a massive amount of data, and even if one piece of information is incorrect or missing, the system will still be able to identify the user as fraudulent.
Knowledge graphs are used by financial institutions to detect fake identities (e.g., people trying to open accounts with fake ID cards), credit card fraud (e.g., someone applying for credit with a stolen credit card), and money laundering (e.g., someone trying to move money from one account into another).
What is a knowledge graph?
A knowledge graph is a database of facts and relations between different entities.
A knowledge graph can be used to represent the world, with objects being concepts or physical things, and their attributes, relationships and metadata. For example, a financial institution could have a knowledge graph containing information about its customers, loans, and employees. The institute might also have a separate knowledge graph containing information about its offices and locations.
Graph databases like NebulaGraph are a natural way of building a knowledge graph because they provide an efficient way of storing relations between entities. A fact can be represented as an entity and its relationship with another entity can be represented as an edge between them. This representation enables us to use graph algorithms on our knowledge graph to find answers to various questions such as if a user is a spam user or if a deal is likely fraudulent.
Related: What is a Graph Database and What are the Benefits of Graph Databases
NebulaGraph is an open-source graph database and it is best for dealing with large volumes of graph data.
NebulaGraph is a distributed, fault-tolerant and transactional graph database that provides ACID transactions, high availability, horizontal scalability and sub-second latency. It's designed to be easy to deploy and operate, both as a standalone instance or as part of a larger cluster.
The steps below outline a typical graph approach to fraud detection.
Related: How I cracked Chinese Wordle using knowledge graph
Data modeling
Fraud detection is a difficult problem for many reasons. For example, it is necessary to distinguish between legitimate requests and fraudulent requests, but many requests are legitimate on the surface but actually fraudulent in nature.
To solve this problem, you need to create a graph of relationships between the various pieces of information available about individual users. The most important piece of information is an account ID. This ID must be associated with all available information: account numbers, user names, IP addresses, social media accounts, email addresses, identification numbers and so on.
Once you have created this graph of relationships, it's possible to use graph algorithms such as the Louvain algorithm and Depth First Search to identify patterns that indicate fraud. This process can be automated so that once a pattern has been identified in one case (e.g., an account number), it can be applied to other cases with similar characteristics.
Knowledge Graphs are very effective in detecting fraud. The relationships between different entities provide context to the data, which helps in detecting fraudulent activity. For example, if you have a knowledge graph of relationships between people and their social media accounts, then you can find out if two accounts belong to the same person or not.
In addition to using graph algorithms, it's also possible to use rule-based systems or human experts who manually inspect suspicious cases and determine whether they're fraudulent or not. This can be done using NebulaGraph's data visualization tool Nebula Explorer, which allows you to manually explore your graph data on a canvas.
Define suspicious patterns
The goal of fraud detection is to identify suspicious activity. One of the most important steps is to define what suspicious activity to look for.
By using a knowledge graph, you can build powerful rules that detect known fraudulent behavior. Here are some examples of what you might want to look for:
Common attributes (same email addresses, tax identification number, or phone number, for instance)
Multiple parties using the same account
Short paths between transactions (a rapid return of purchase with no support call or reason given, for example)
Transactions outside normal patterns (a large payment made at 3 AM on a Saturday morning)
Run graph algorithms
Once you have defined suspicious patterns in your fraud detection system, you can run graph queries using various graph algorithms in the knowledge graph to help you identifies these behaviors.
Here are some of the graph algorithms that are best for fraud detection in knowledge graph. You can use Nebula Algorithm To use these algorithms in your knowledge graph, which is also open source.
Louvain
The Louvain method is a simple, efficient and easy-to-implement method for identifying communities in large networks.
The method unveils hierarchies of communities and allows to zoom within communities to discover sub-communities, sub-sub-communities, etc. It is today one of the most widely used methods for detecting communities in large networks.
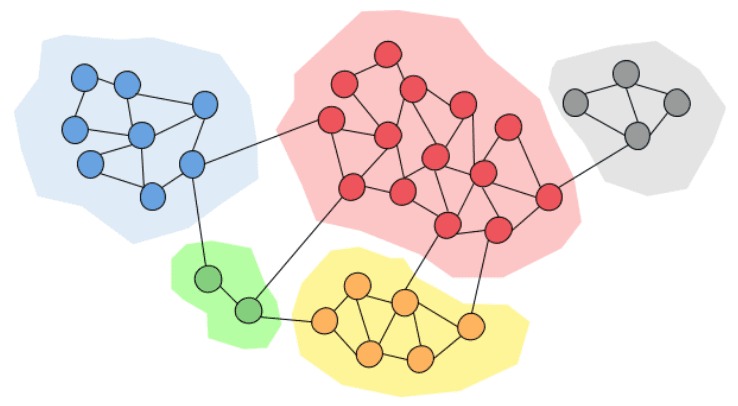
The Louvain method has been shown capable of detecting communities even when they are not well separated from each other, which makes it useful when analyzing complex networks such as fraud networks where communities may overlap with each other.
PageRank
The PageRank algorithm was introduced by Google founder Lary Page. It was first used to rank web pages in the Google search engine. Nowadays, it is more and more used in many different fields, for example, in uncovering influential individuals and identifying high-frequency paths in fraud detection.
Influential individuals and high-frequency paths are both important characteristics of fraudsters as they tend to be more influential than others in their network and also tend to be connected through multiple schemes.
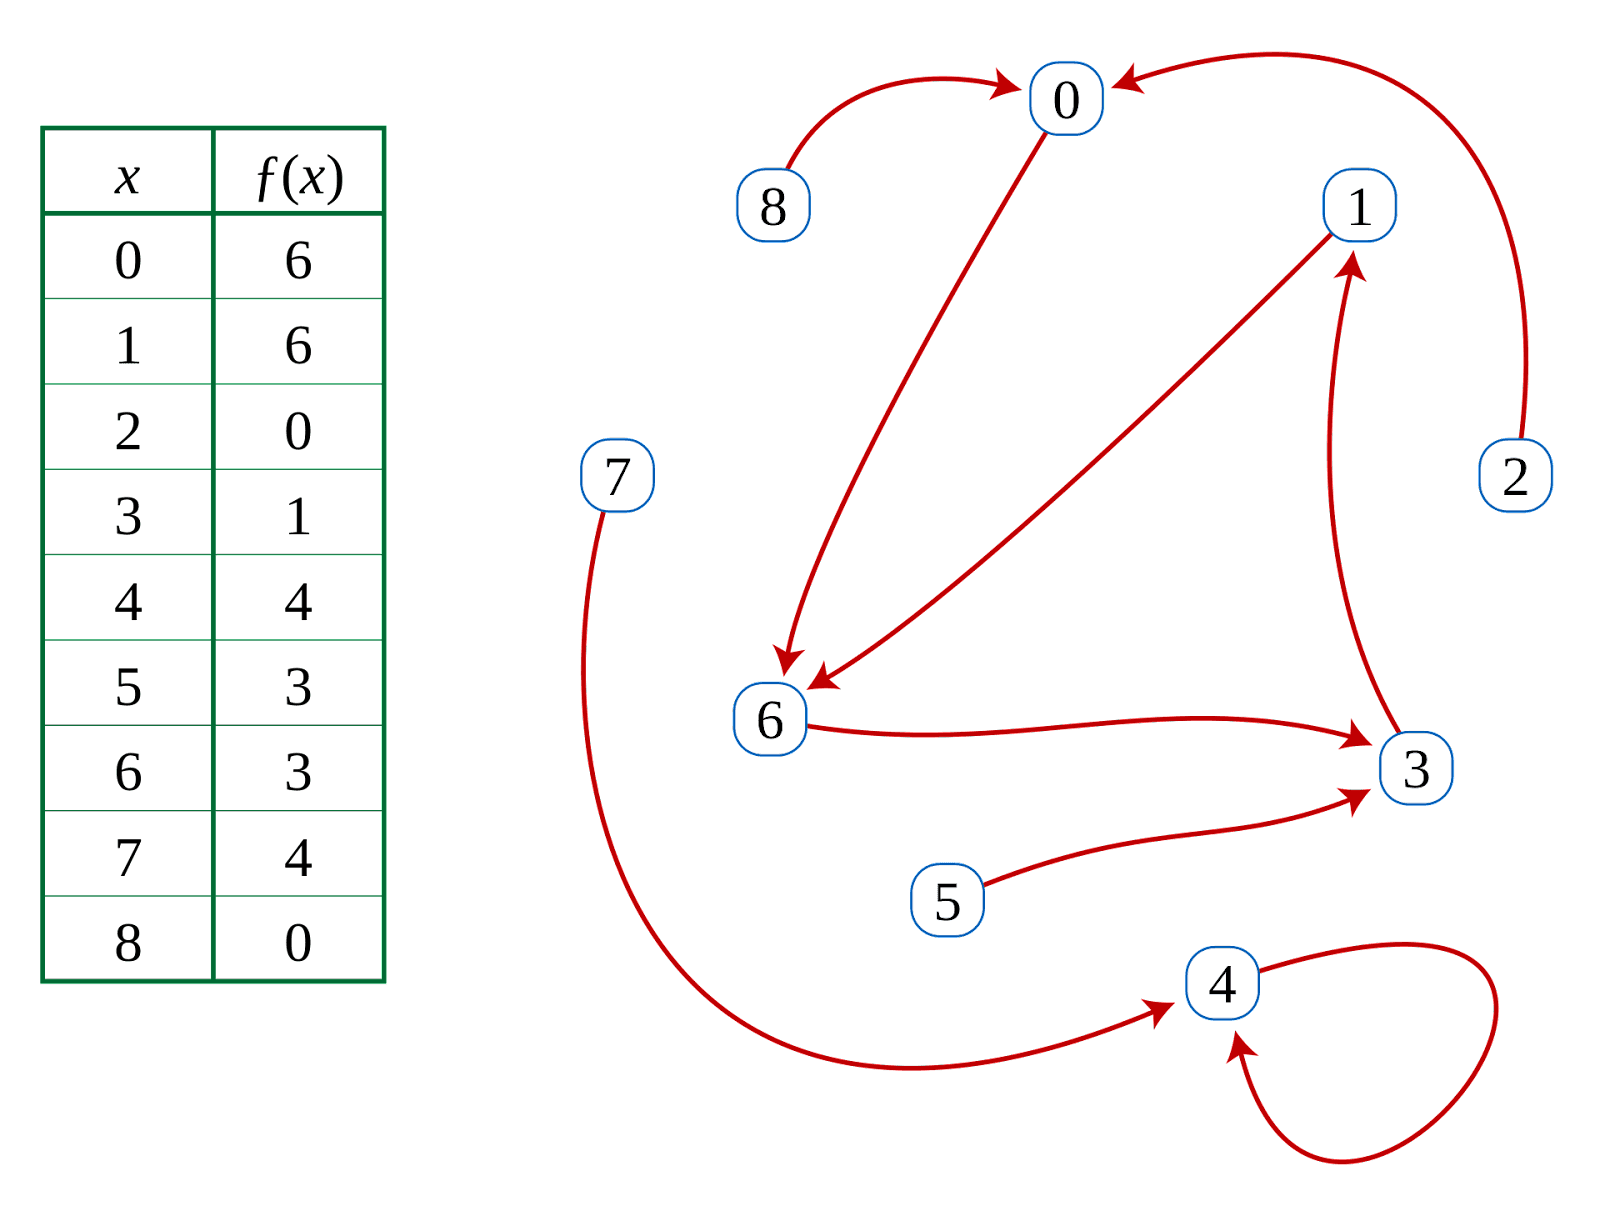
Cycle detection
Cycle detection is especially a good fit for anti-money laundering applications. One of the money laundering patterns is a circular money flow. Money is being transferred from one account to another and eventually lands back in the originator’s account.
Using the cycle detection algorithm in your knowledge graph you can easily find such loops. For example, if a transaction involves multiple users and accounts, the system can detect if there is a circular flow between them.
Cycle detection does not only work for money laundering but also for other forms of fraud like credit card fraud or identity theft.
Visualize your data
Data visualization is the process of presenting data in a visual form that helps to identify patterns, trends and relationships. The goal of data visualization is to turn raw numbers into meaningful information that can be understood by anyone.
Graph visualization helps you quickly analyze large amounts of data and spot patterns that indicate fraudulent activity. It allows you to investigate specific transaction patterns, find anomalies in real-time, and visualize complex relationships between entities. With this visual approach, you can also take advantage of graph algorithms to identify fraudulent transactions more efficiently than humans can.
Graph visualization cuts the manual analyst review time in half, allowing them to stop fraudulent transactions sooner and reduce wait times for non-fraudulent customers.
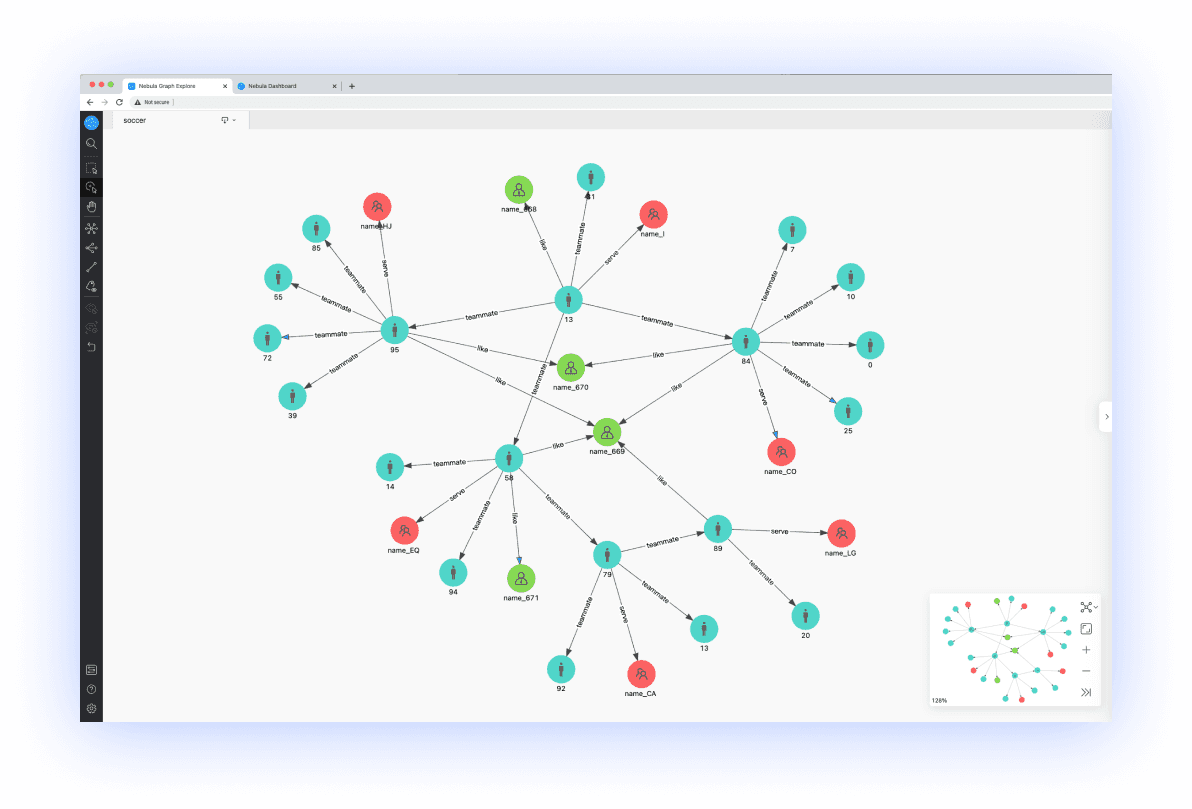
Nebula Explorer is a graph data exploration app built upon NebulaGraph database. Taking advantage of the latest technologies, it is easy and fast to load large-scale graph data, query the data with visualized graphs, and identify fraudulent activities in a visualized way.
Conclusion
The global economy is facing increasing risks due to fraud. The technological challenge of quickly recognizing and analyzing massive volumes of transaction data makes fraud detection a very complex task. To meet mounting expectations, financial institutions and banks must use innovative technologies for efficient, comprehensive and reliable fraud detection such as graph technology.
It is clear that graph technology offers many advantages when it comes to fraud detection. This is an area in which "the more the better" also applies, as the number of available variables increases and their interconnections get richer and deeper. Graph databases can handle this without loading any additional costs – that is a key advantage. To conclude: fraud detection has been not just made more efficient, but more manageable in general by the use of graph technology.
About the author
Nick Russell is a freelancing technical writer with a special focus on graph technology, machine learning and cloud computing.
References
Internet Financial Fraud Detection Based on a Distributed Big Data Approach With Node2vec - IEEE
Fraud Detection Using Graph Analytics - Md. Ekramul Hoque Shajib
Financial Crime & Fraud Detection Using Graph Computing: Application Considerations & Outlook - arvix
