Technical Deep Dives
Jun 14, 2022
Introducing a metadata management system that uses NebulaGraph as graph database
Wey Gu
Do I have to create my own graph model and everything to set up a Data Lineage system? Thanks to many great open-source projects, the answer is: No!
Today, I would like to share my opinionated reference data infra stack with some of those best open-source projects with modern ETL, Dashboard, Metadata Governance, and Data Lineage Management.
Metadata Governance system
A Metadata Governance system is a system providing a single view of where and how all the data are formatted, generated, transformed, consumed, presented, and owned.
Metadata Governance is like a catalog of all of the data warehouses, databases, tables, dashboards, ETL jobs, etc so that people don't have to broadcast their queries on "Hi everyone, could I change the schema of this table?", "Hey, anyone who knows how I could find the raw data of table-view-foo-bar?", which, explains why we need a Metadata Governance system in a mature data stack with a relatively large scale of data and team(or one to be grown to).
For the other term, Data Lineage, is one of the Metadata that needs to be managed, for example, some dashboard is the downstream of a table view, which has an upstream as two other tables from different databases. That information should be managed at best when possible, too, to enable a trust chain on a data-driven team.
The reference solution
Motivation
The metadata and data lineage are by nature fitting to the graph model/graph database well, and the relationship-oriented queries, for instance, "finding all n-depth data lineage per given component(i.e. a table)" is a FIND ALL PATH query in a graph database.
This also explains one observation of mine as an OSS contributor of NebulaGraph, a distributed graph database: (from their queries/graph modeling in discussions I could tell) a bunch of teams who are already levering NebulaGraph on their tech stack, are setting up a data lineage system on their own, from scratch.
A Metadata Governance system needs some of the following components:
Metadata Extractor
This part is needed to either pull or be pushed from the different parties of the data stack like databases, data warehouses, dashboards, or even from ETL pipeline and applications, etc.
Metadata Storage
This could be either a database or even large JSON manifest files
Metadata Catalog
This could be a system providing API and/or a GUI interface to read/write the metadata and data lineage
In NebulaGraph community, I had been seeing many graph database users were building their in-house data lineage system. It’s itching witnessing this entropy increase situation not be standarized or jointly contributed instead, as most of their work are parsing metadata from well-known big-data projects, and persistent into a graph database, which, I consider high probability that the work is common.
Then I came to create an opinionated reference data infra stack with some of those best open-source projects put together. Hopefully, those who were gonna define and iterate their own fashion of Graph Model on NebulaGraph and create in-house Metadata and data linage extracting pipelines can benefit from this project to have a relatively polished, beautifully designed, Metadata Governance system out of the box with a fully evolved graph model.
To make the reference project self-contained and runnable, I tried to put layers of data infra stack more than just pure metadata related ones, thus, maybe it will help new data engineers who would like to try and see how far had open-source pushed a modern data lab to.
This is a diagram of all the components in this reference data stack, where I see most of them as Metadata Sources:

The Data Stack
Then, let's introduce the components.
Database and Data Warehouse
For processing and consuming raw and intermediate data, one or more databases and/or warehouses should be used.
It could be any DB/DW like Hive, Apache Delta, TiDB, Cassandra, MySQL, or Postgres, in this reference project, we simply choose one of the most popular ones: Postgres. And our reference lab comes with the first service:
✅ - Data warehouse: Postgres
DataOps
We should have some sort of DataOps setup to enable pipelines and environments to be repeatable, testable, and version-controlled.
Here, we used Meltano created by GitLab.
Meltano is a just-work DataOps platform that connected Singer as the EL and dbt as the T in a magically elegant way, it is also connected to some other dataInfra utilities such as Apache Superset and Apache Airflow, etc.
Thus, we have one more thing to be included:
✅ - GitOps: Meltano
ETL
And under the hood, we will E(extract) and L(load) data from many different data sources to data targets leveraging Singer together with Meltano, and do T(transformation) with dbt.
✅ - EL: Singer
✅ - T: dbt
Data Visualization
How about creating dashboards, charts, and tables for getting the insights into all the data?
Apache Superset is one of the greatest visualization platforms we could choose from, and we just add it to our packet!
✅ - Dashboard: Apache Superset
Job Orchestration
In most cases, our DataOps jobs grow to the scale to be executed in a long time that needs to be orchestrated, and here comes the Apache Airflow.
✅ - DAG: Apache Airflow
Metadata governance
With more components and data being introduced to a data infra, there will be massive metadata in all lifecycle of databases, tables, schemas, dashboards, DAGs, applications, and their administrators and teams could be collectively managed, connected, and discovered.
Linux Foundation Amundsen is one of the best projects solving this problem.
✅ - Data Discovery: Linux Foundation Amundsen
With a graph database as the source of truth to accelerate the multi-hop queries together with elasticsearch as the full-text search engine, Amundsen indexes all the metadata and their lineage smoothly, and beautifully in the next level.
By default, neo4j was used as the graph database, while I will be using NebulaGraph instead in this project due to I am more familiar with the latter.
✅ - Full-text Search: elasticsearch
✅ - Graph Database: NebulaGraph
Now, with the components in our stack being revealed, let's have them assembled.
Environment Bootstrap, Component overview
The reference runnable project is open-source and you could find it here:
https://github.com/wey-gu/data-lineage-ref-solution
I will try my best to make things clean and isolated. It's assumed you are running on a UNIX-like system with internet and Docker Compose being installed.
Please refer here to install Docker and Docker Compose before moving forward.
I am running it on Ubuntu 20.04 LTS X86_64, but there shouldn't be issues on other distros or versions of Linux.
Run a Data Warehouse/ Database
First, let's install Postgres as our data warehouse.
This oneliner will help create a Postgres running in the background with docker, and when being stopped it will be cleaned up(--rm).
Then we could verify it with Postgres CLI or GUI clients.
Hint: You could use VS Code extension: SQL tools to quickly connect to multiple RDBMS(MariaDB, Postgres, etc.) or even Non-SQL DBMS like Cassandra in a GUI fashion.
Setup DataOps toolchain for ETL
Then, let's get Meltano with Singler and dbt installed.
Meltano helps us manage ETL utilities(as plugins) and all of their configurations(the pipelines). Those meta-information sits in meltano configurations and its system database, where the configurations are file-based(could be managed with git) and by default the system database is SQLite.
Installation of Meltano
The workflow using Meltano is to initiate a meltano project and start to add E, L, and T into the configuration files. The initiation of a project just requires a CLI command call: meltano init yourprojectname and to do that, we could install Meltano either with Python's package manager: pip or via a Docker image:
Install Meltano with pip in a python virtual env:
"Install" Meltano via Docker
Apart from meltano init, there are a couple of other commands like meltano etl to perform ETL executions, and meltano invoke <plugin> to call plugins' command, always check the cheatsheet for quick referencing.
The Meltano UI
Meltano also comes with a web-based UI, to start it, just run:
Then it's listening to http://localhost:5000.
For Docker, just run the container with the 5000 port exposed, here we didn't provide ui in the end due to the container's default command being meltano ui already.
Example Meltano projects
When writing this article, I noticed that Pat Nadolny had created great examples on an example dataset for Meltano with dbt(And with Airflow and Superset, too!). We will not recreate the examples and use Pat's great ones.
Note that Andrew Stewart had created another one with a slightly older version of configuration files.
You could follow here to run a pipeline of:
tap-CSV(Singer), extracting data from CSV files
target-postgres(Singer), loading data to Postgres
dbt, transform the data into aggregated tables or views
You should omit the step of running the local Postgres with docker as we had already created one, be sure to change the Postgres user and password in
.env.And it's basically as this(with meltano being installed as above):
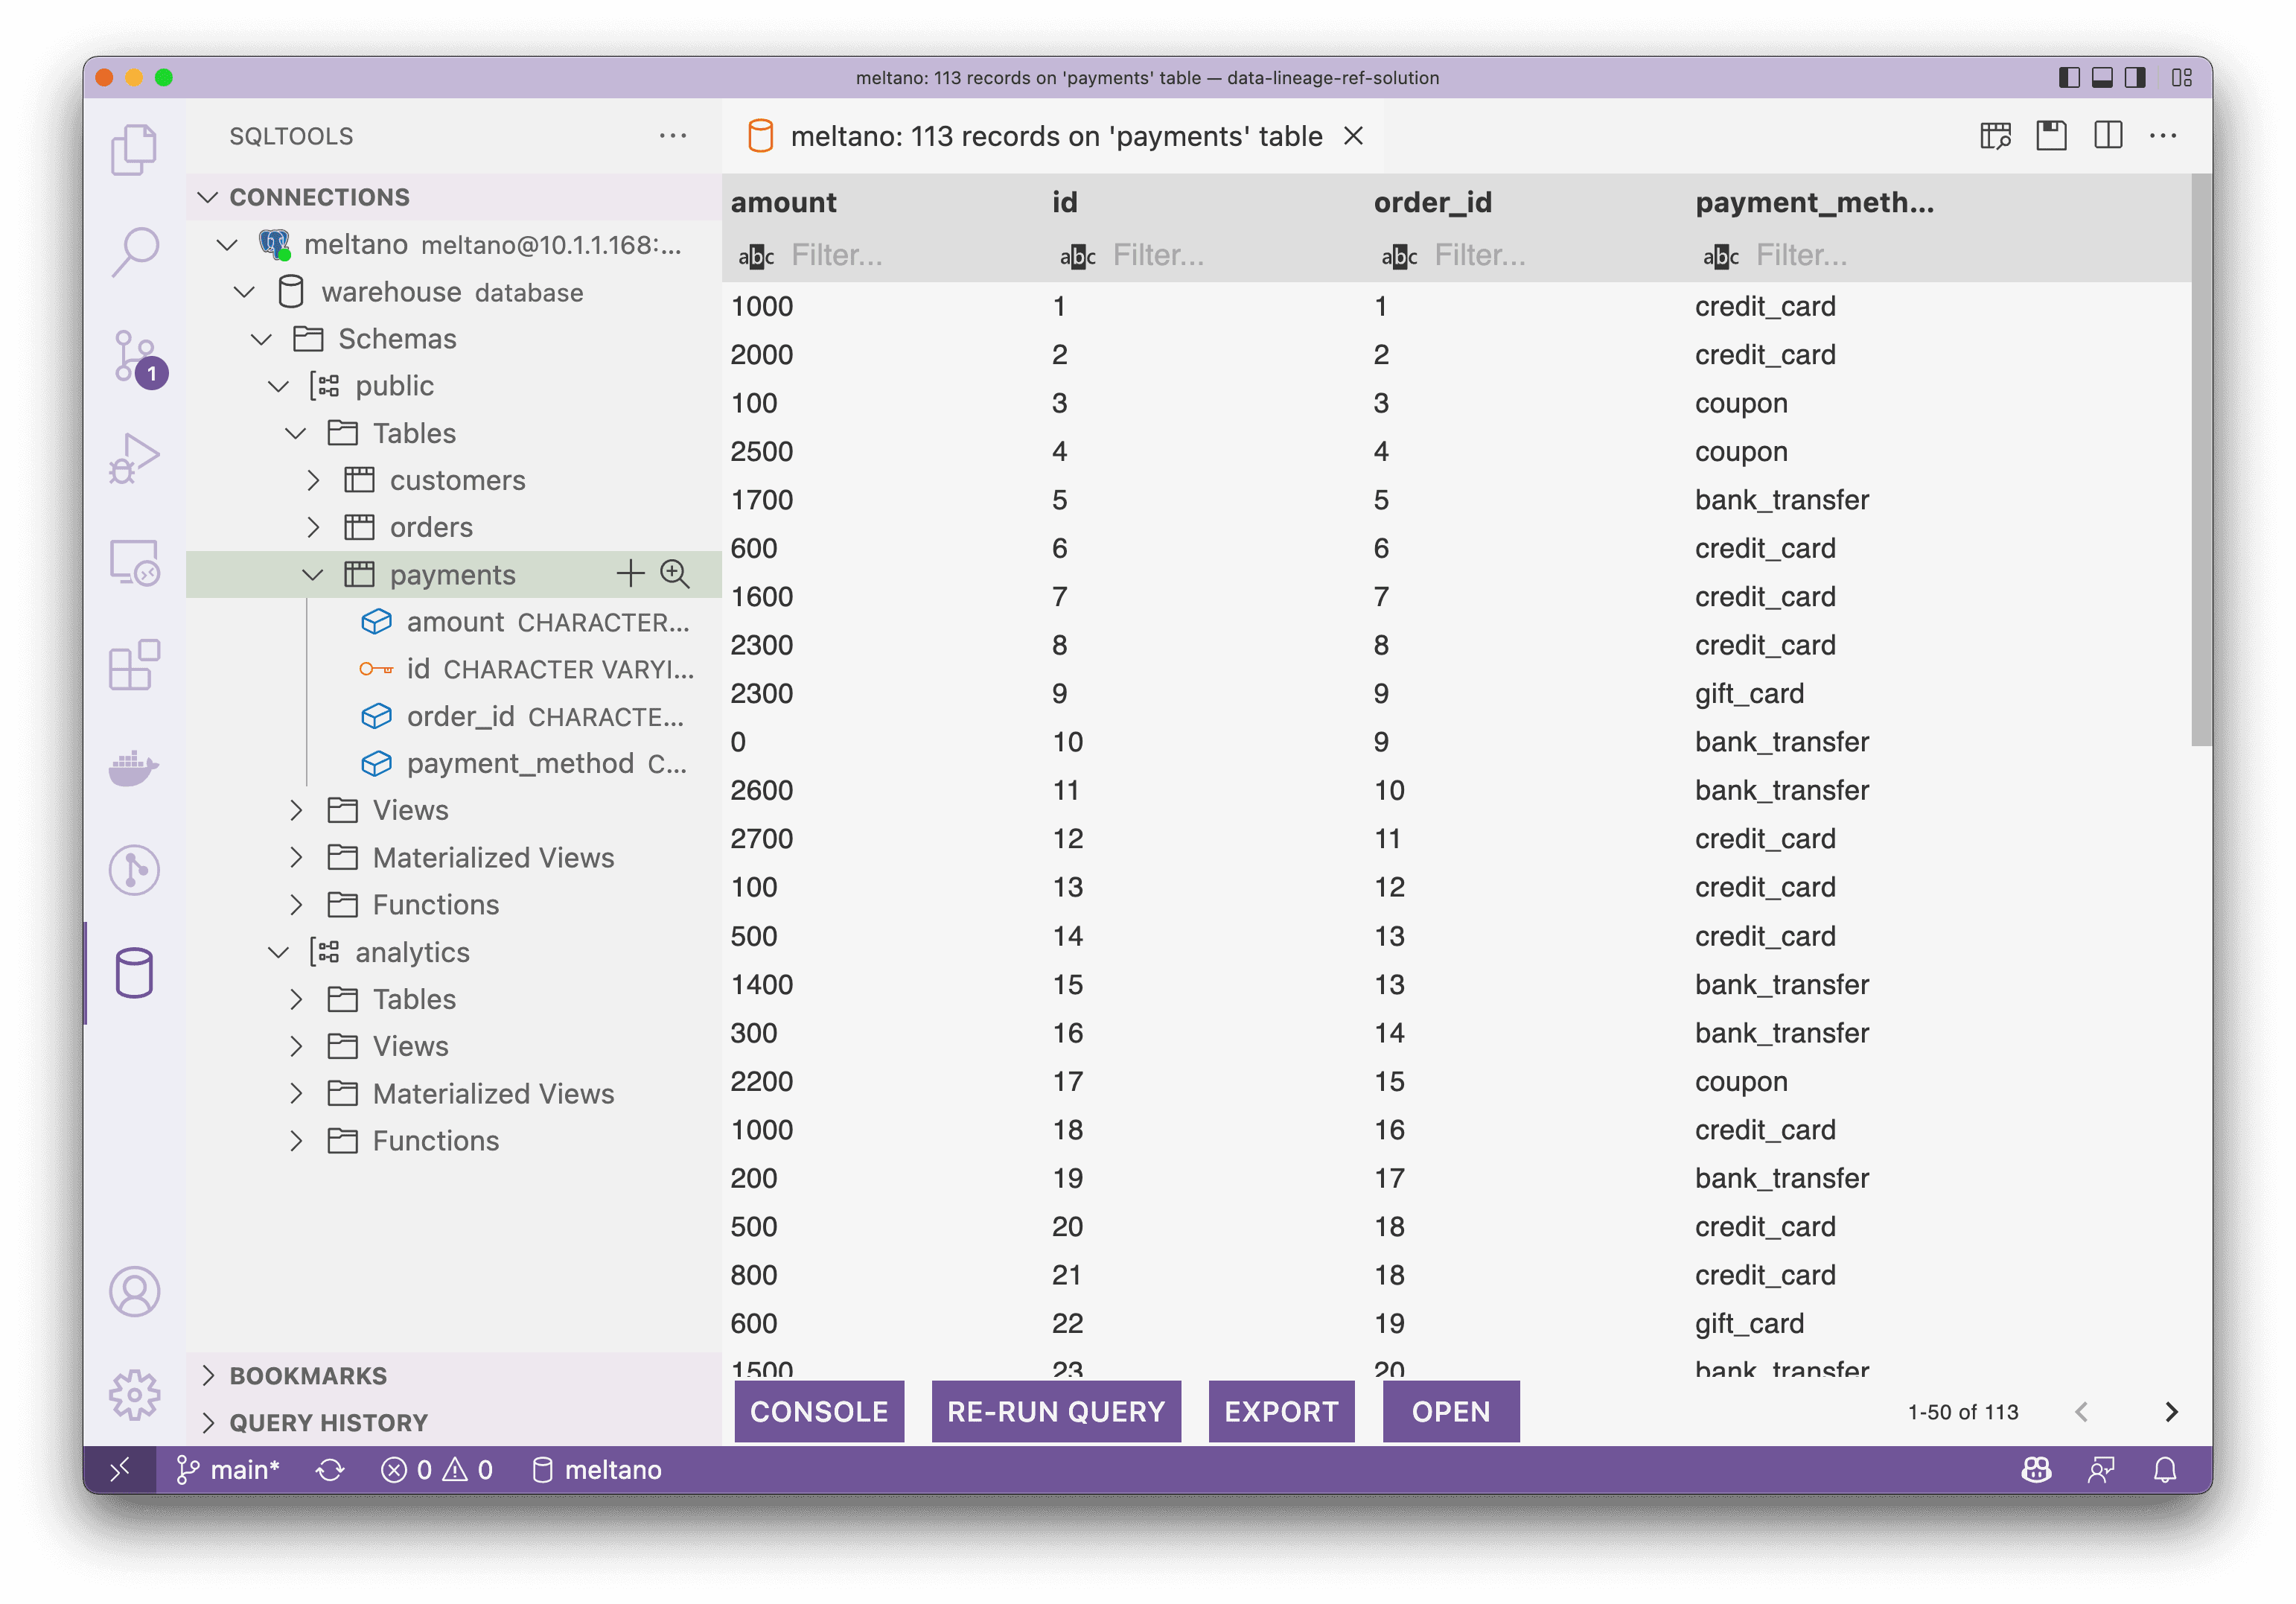
Now, I assumed you had finished trying out singer_dbt_jafflefollowing its README.md, and we could connect to the Postgres to see the loaded and transformed data being reflected as follow, the screenshot is from the SQLTool of VS Code:
Setup a BI Platform for Dashboard
Now, we have the data in data warehouses, with ETL toolchains to pipe different data sources into it. How could those data be consumed?
BI tools like the dashboard could be one way to help us get insights from the data.
With Apache Superset, dashboards, and charts based on those data sources could be created and managed smoothly and beautifully.
The focus of this project was not on Apache Superset itself, thus, we simply reuse examples that Pat Nadolny had created in Superset as a utility if meltano Example.
Bootstrap Meltano and Superset
Create a python venv with Meltano installed:
Following Pat's guide, with tiny modifications:
Clone the repo, enter the
jaffle_supersetproject
Modify the meltano configuration files to let Superset connect to the Postgres we created:
In my example, I changed the hostname to 10.1.1.111, which is the IP of my current host, while if you are running it on your macOS machine, this should be fine to leave with it, the diff before and after the change would be:
Add Postgres credential to
.envfile:
Install the Meltano project, run ETL pipeline
Start Superset, please note that the
uiis not a meltano command but a user-defined action in the configuration file.
In another terminal, run the defined command
load_datasources
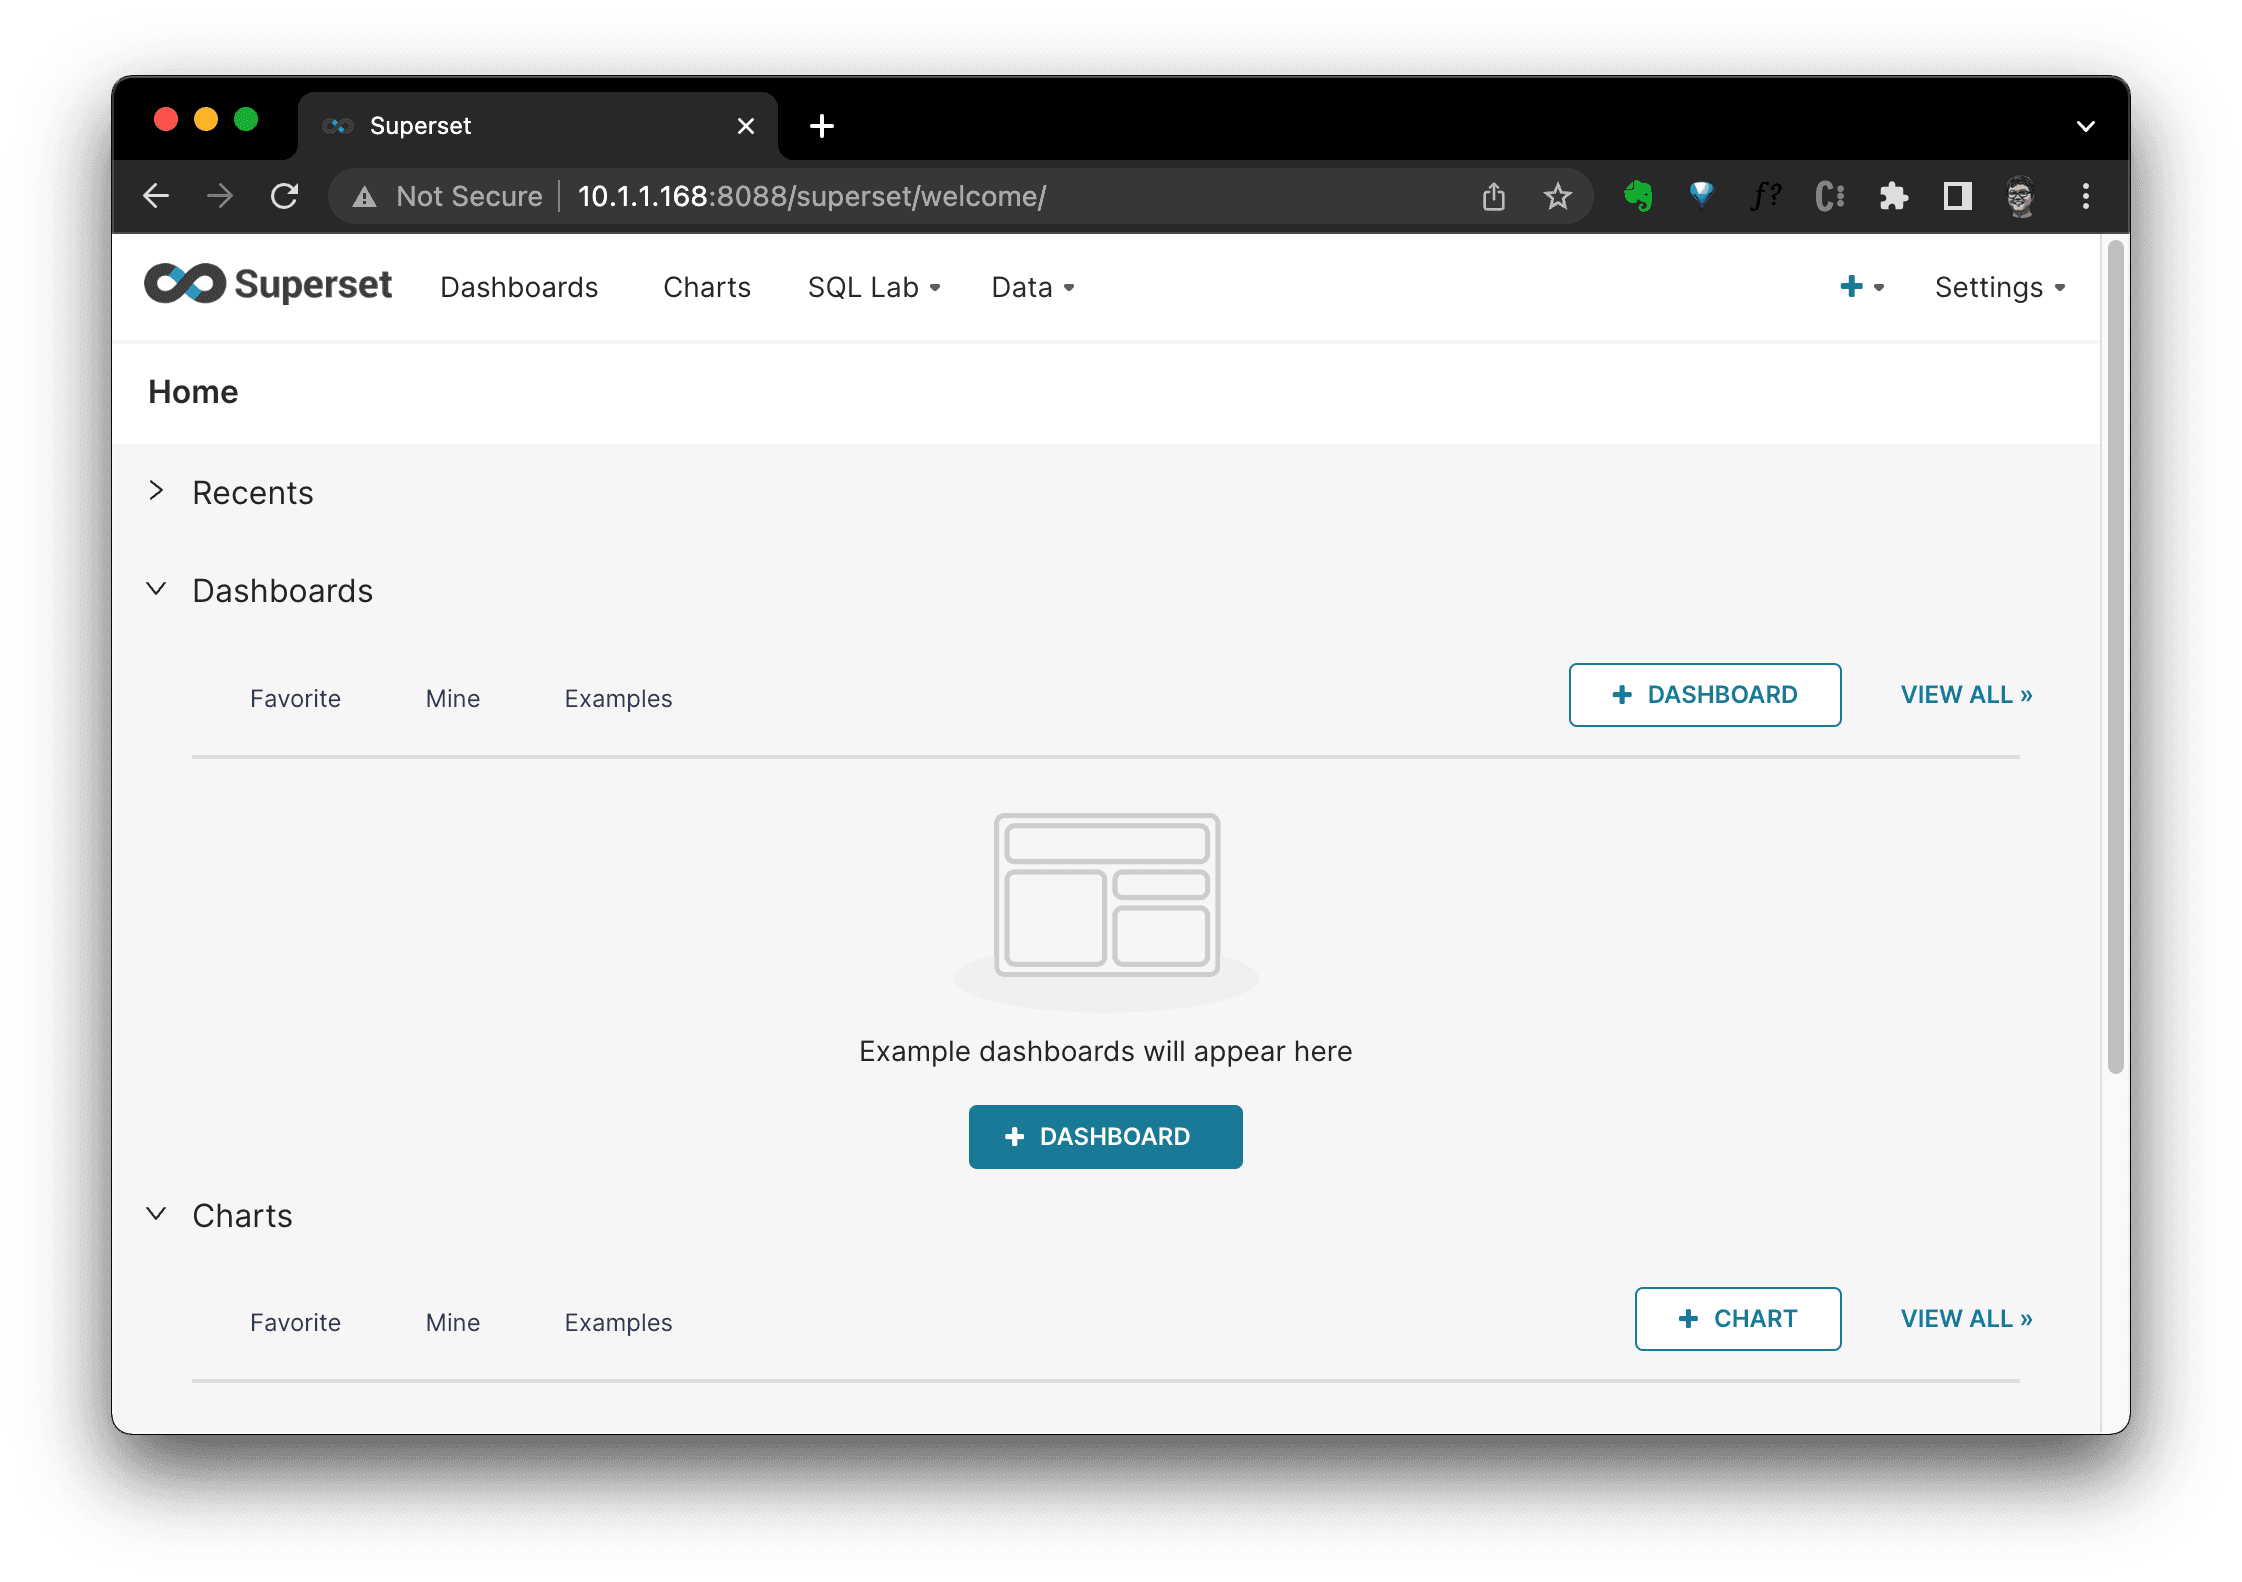
Access Superset in a web browser via http://localhost:8088/
We should now see Superset Web Interface:
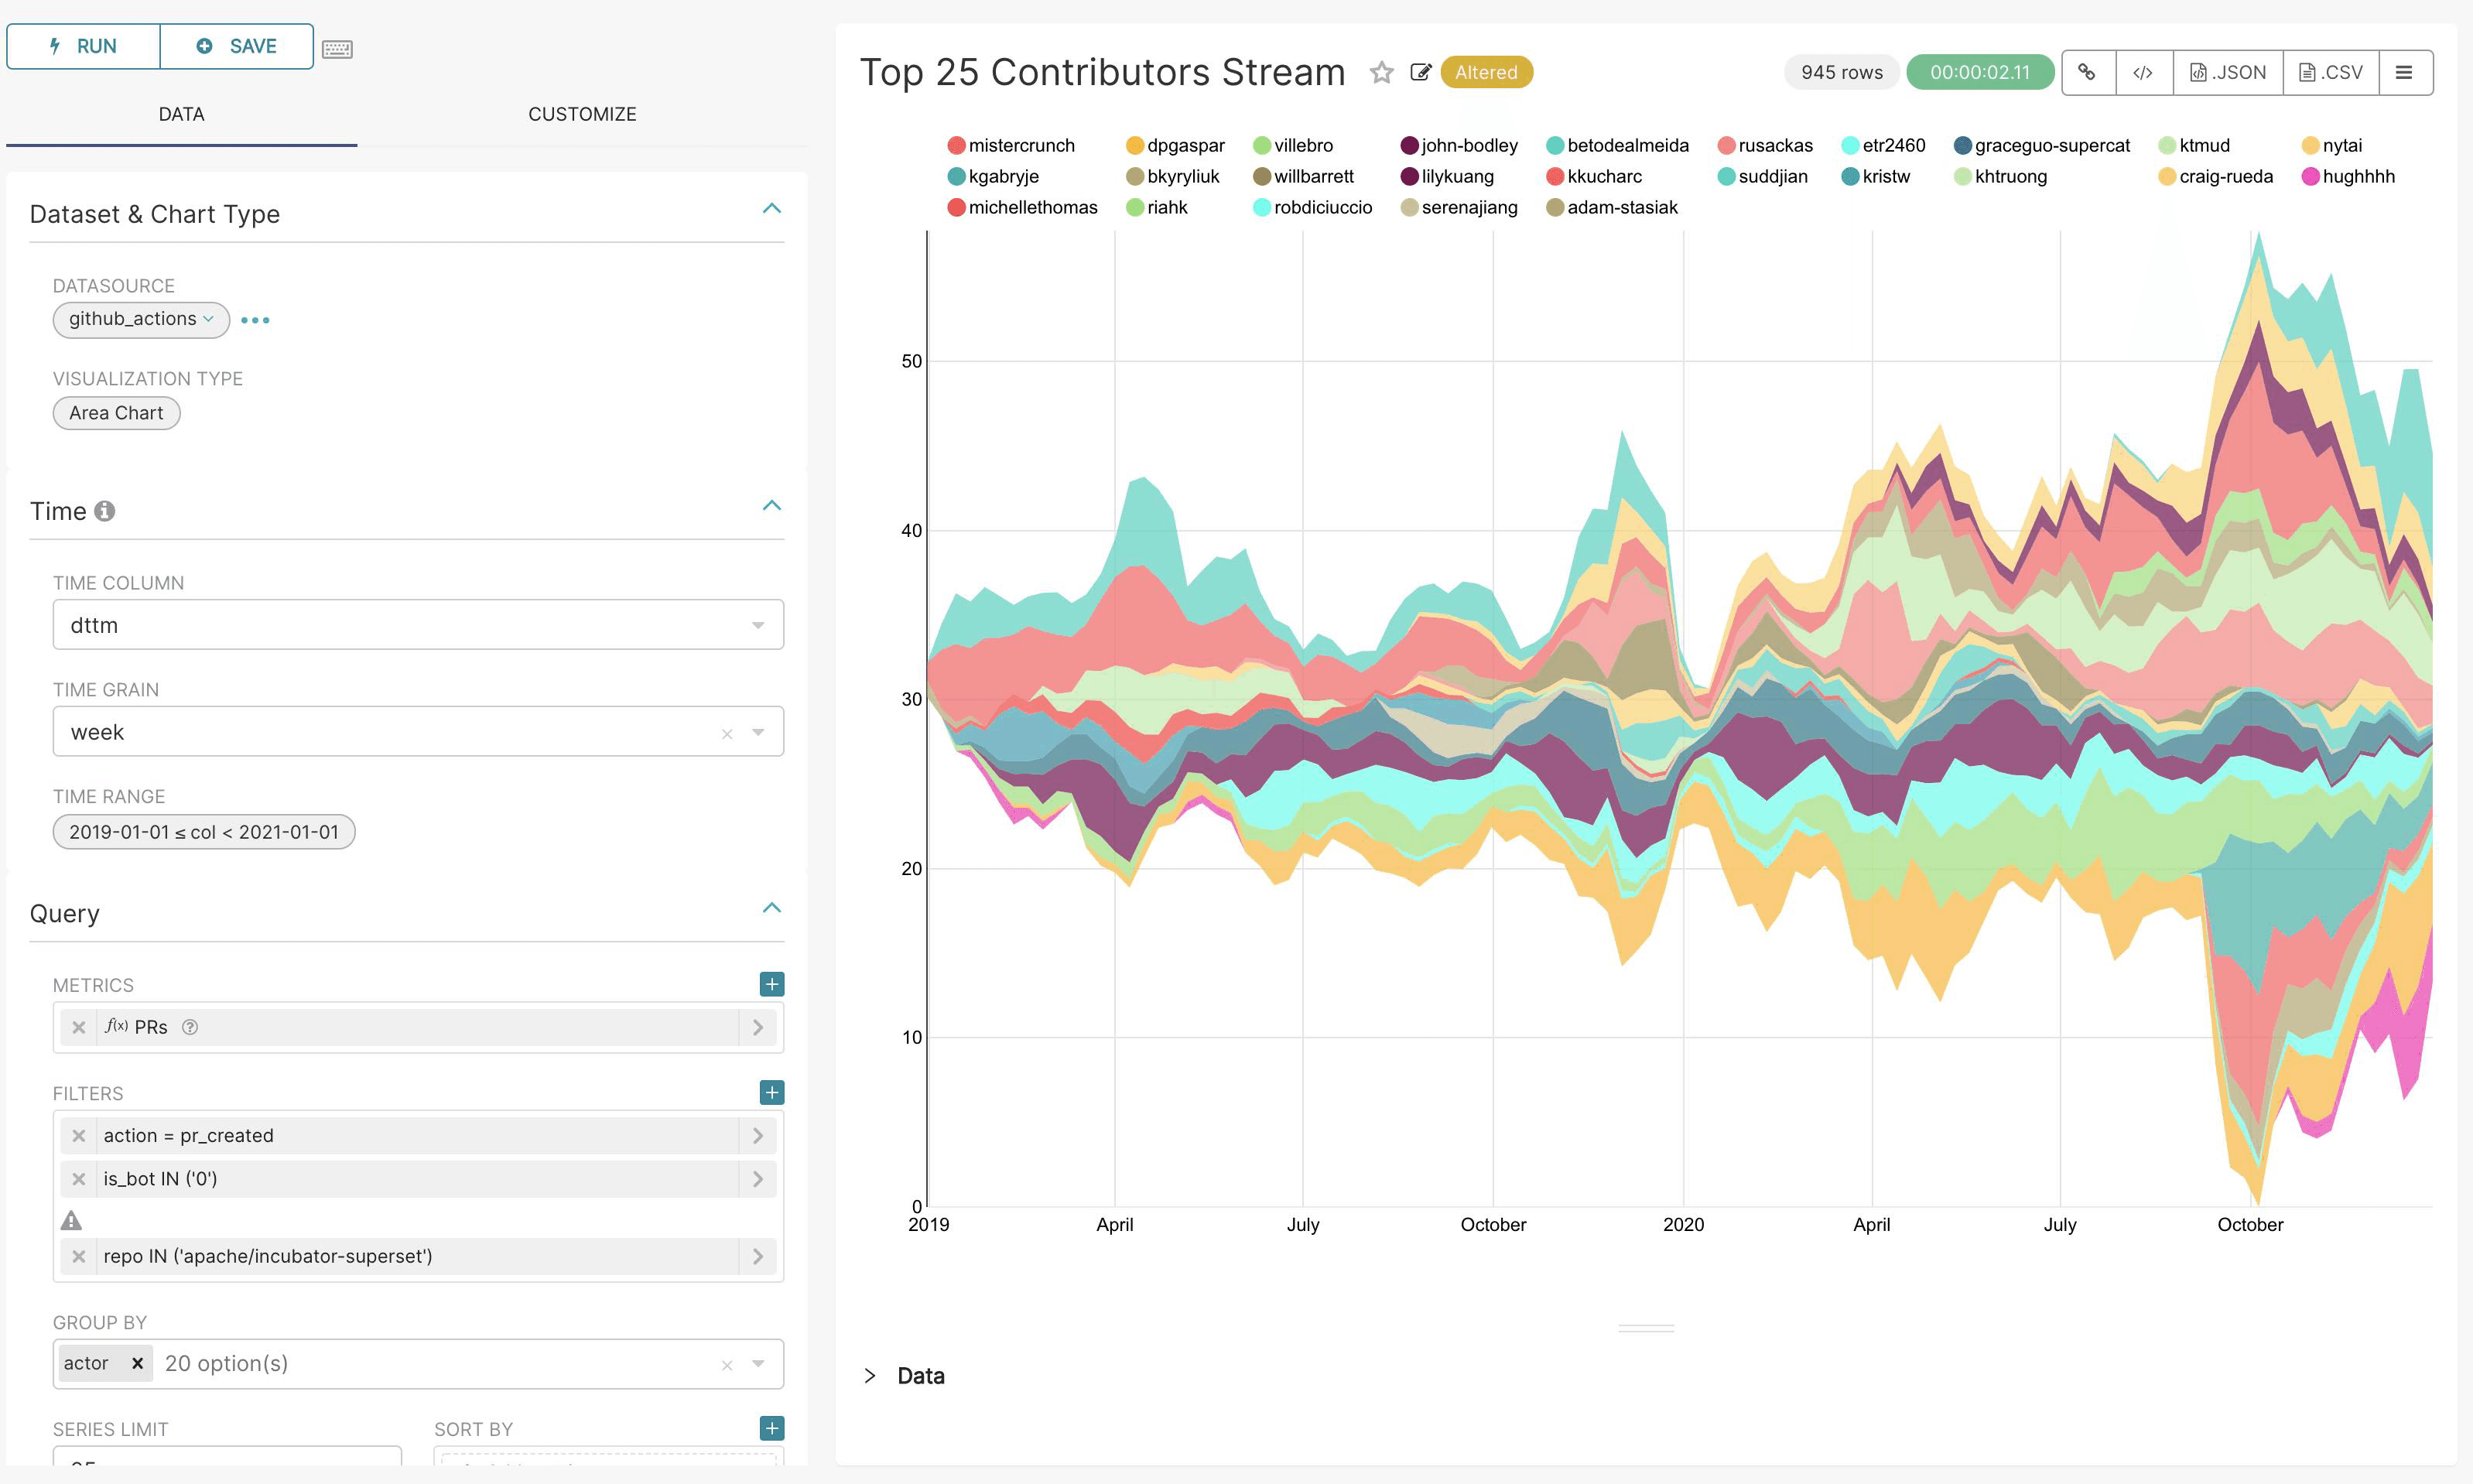
Create a Dashboard!
Let's try to create a Dashboard on the ETL data in Postgres defined in this Meltano project:
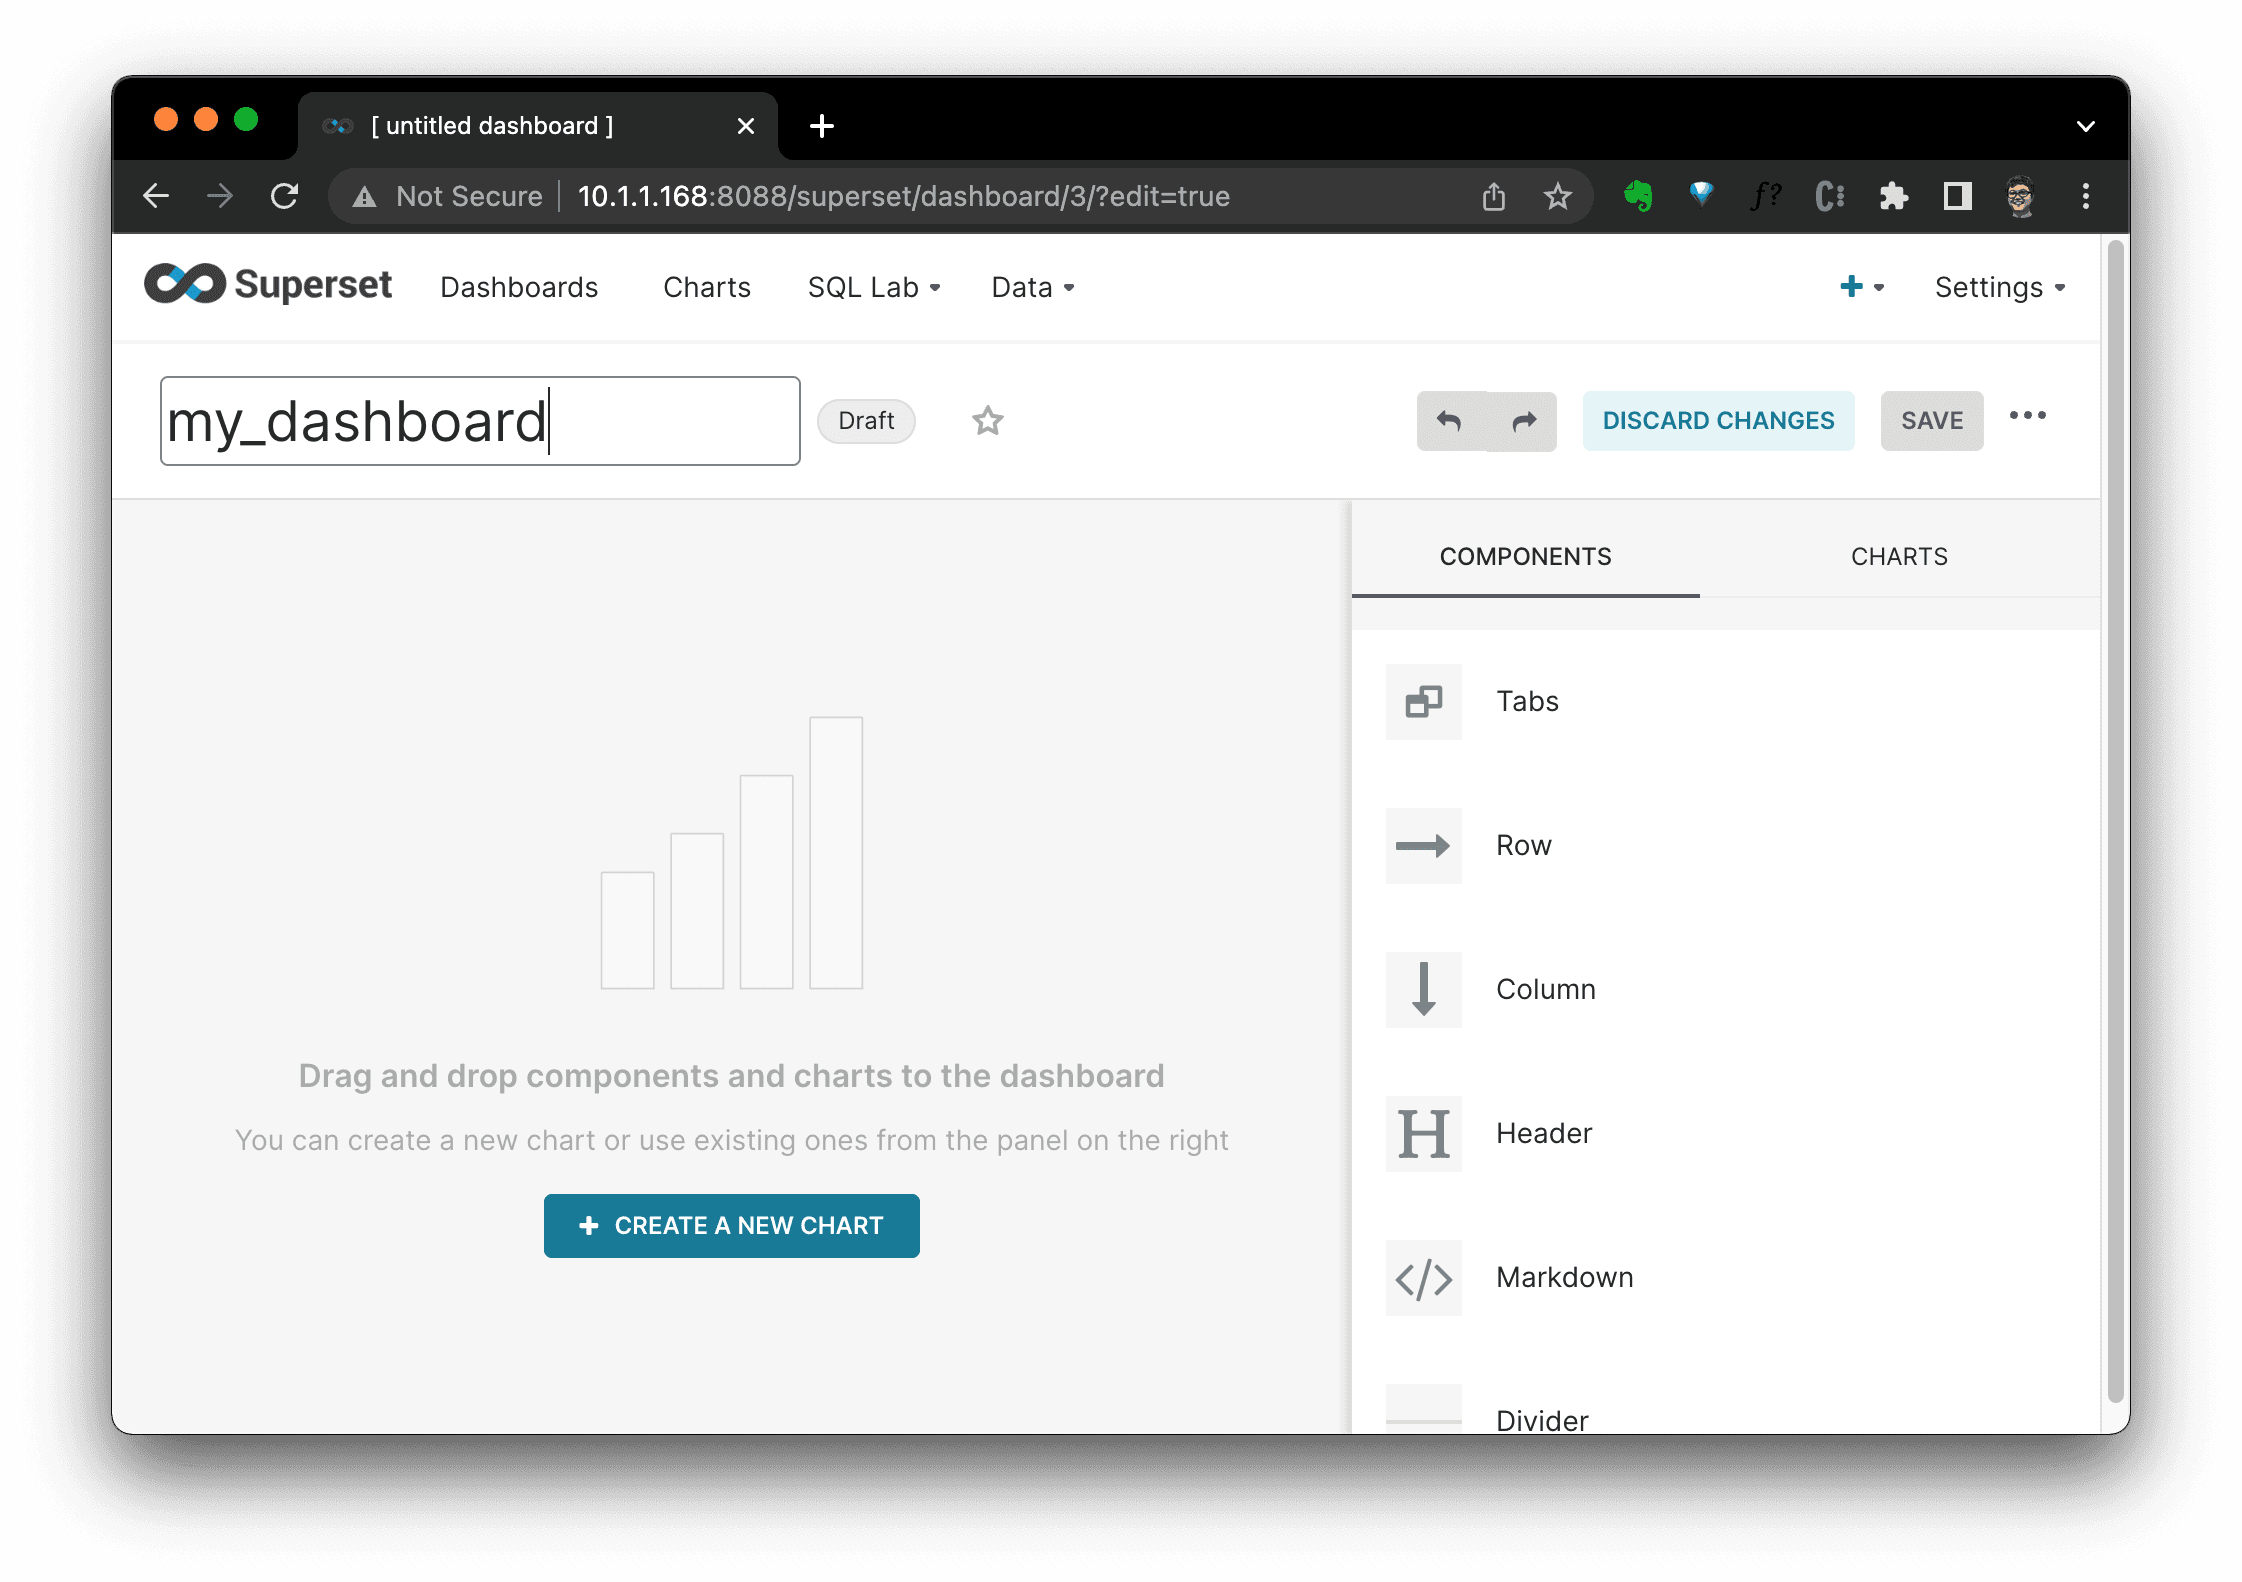
Click
+ DASHBOARD, fill a dashboard name, then clickSAVE, then clieck+ CREATE A NEW CHART
In new chart view, we should select a chart type and DATASET. Here, I selected
orderstable as the data source andPie Chartchart type:
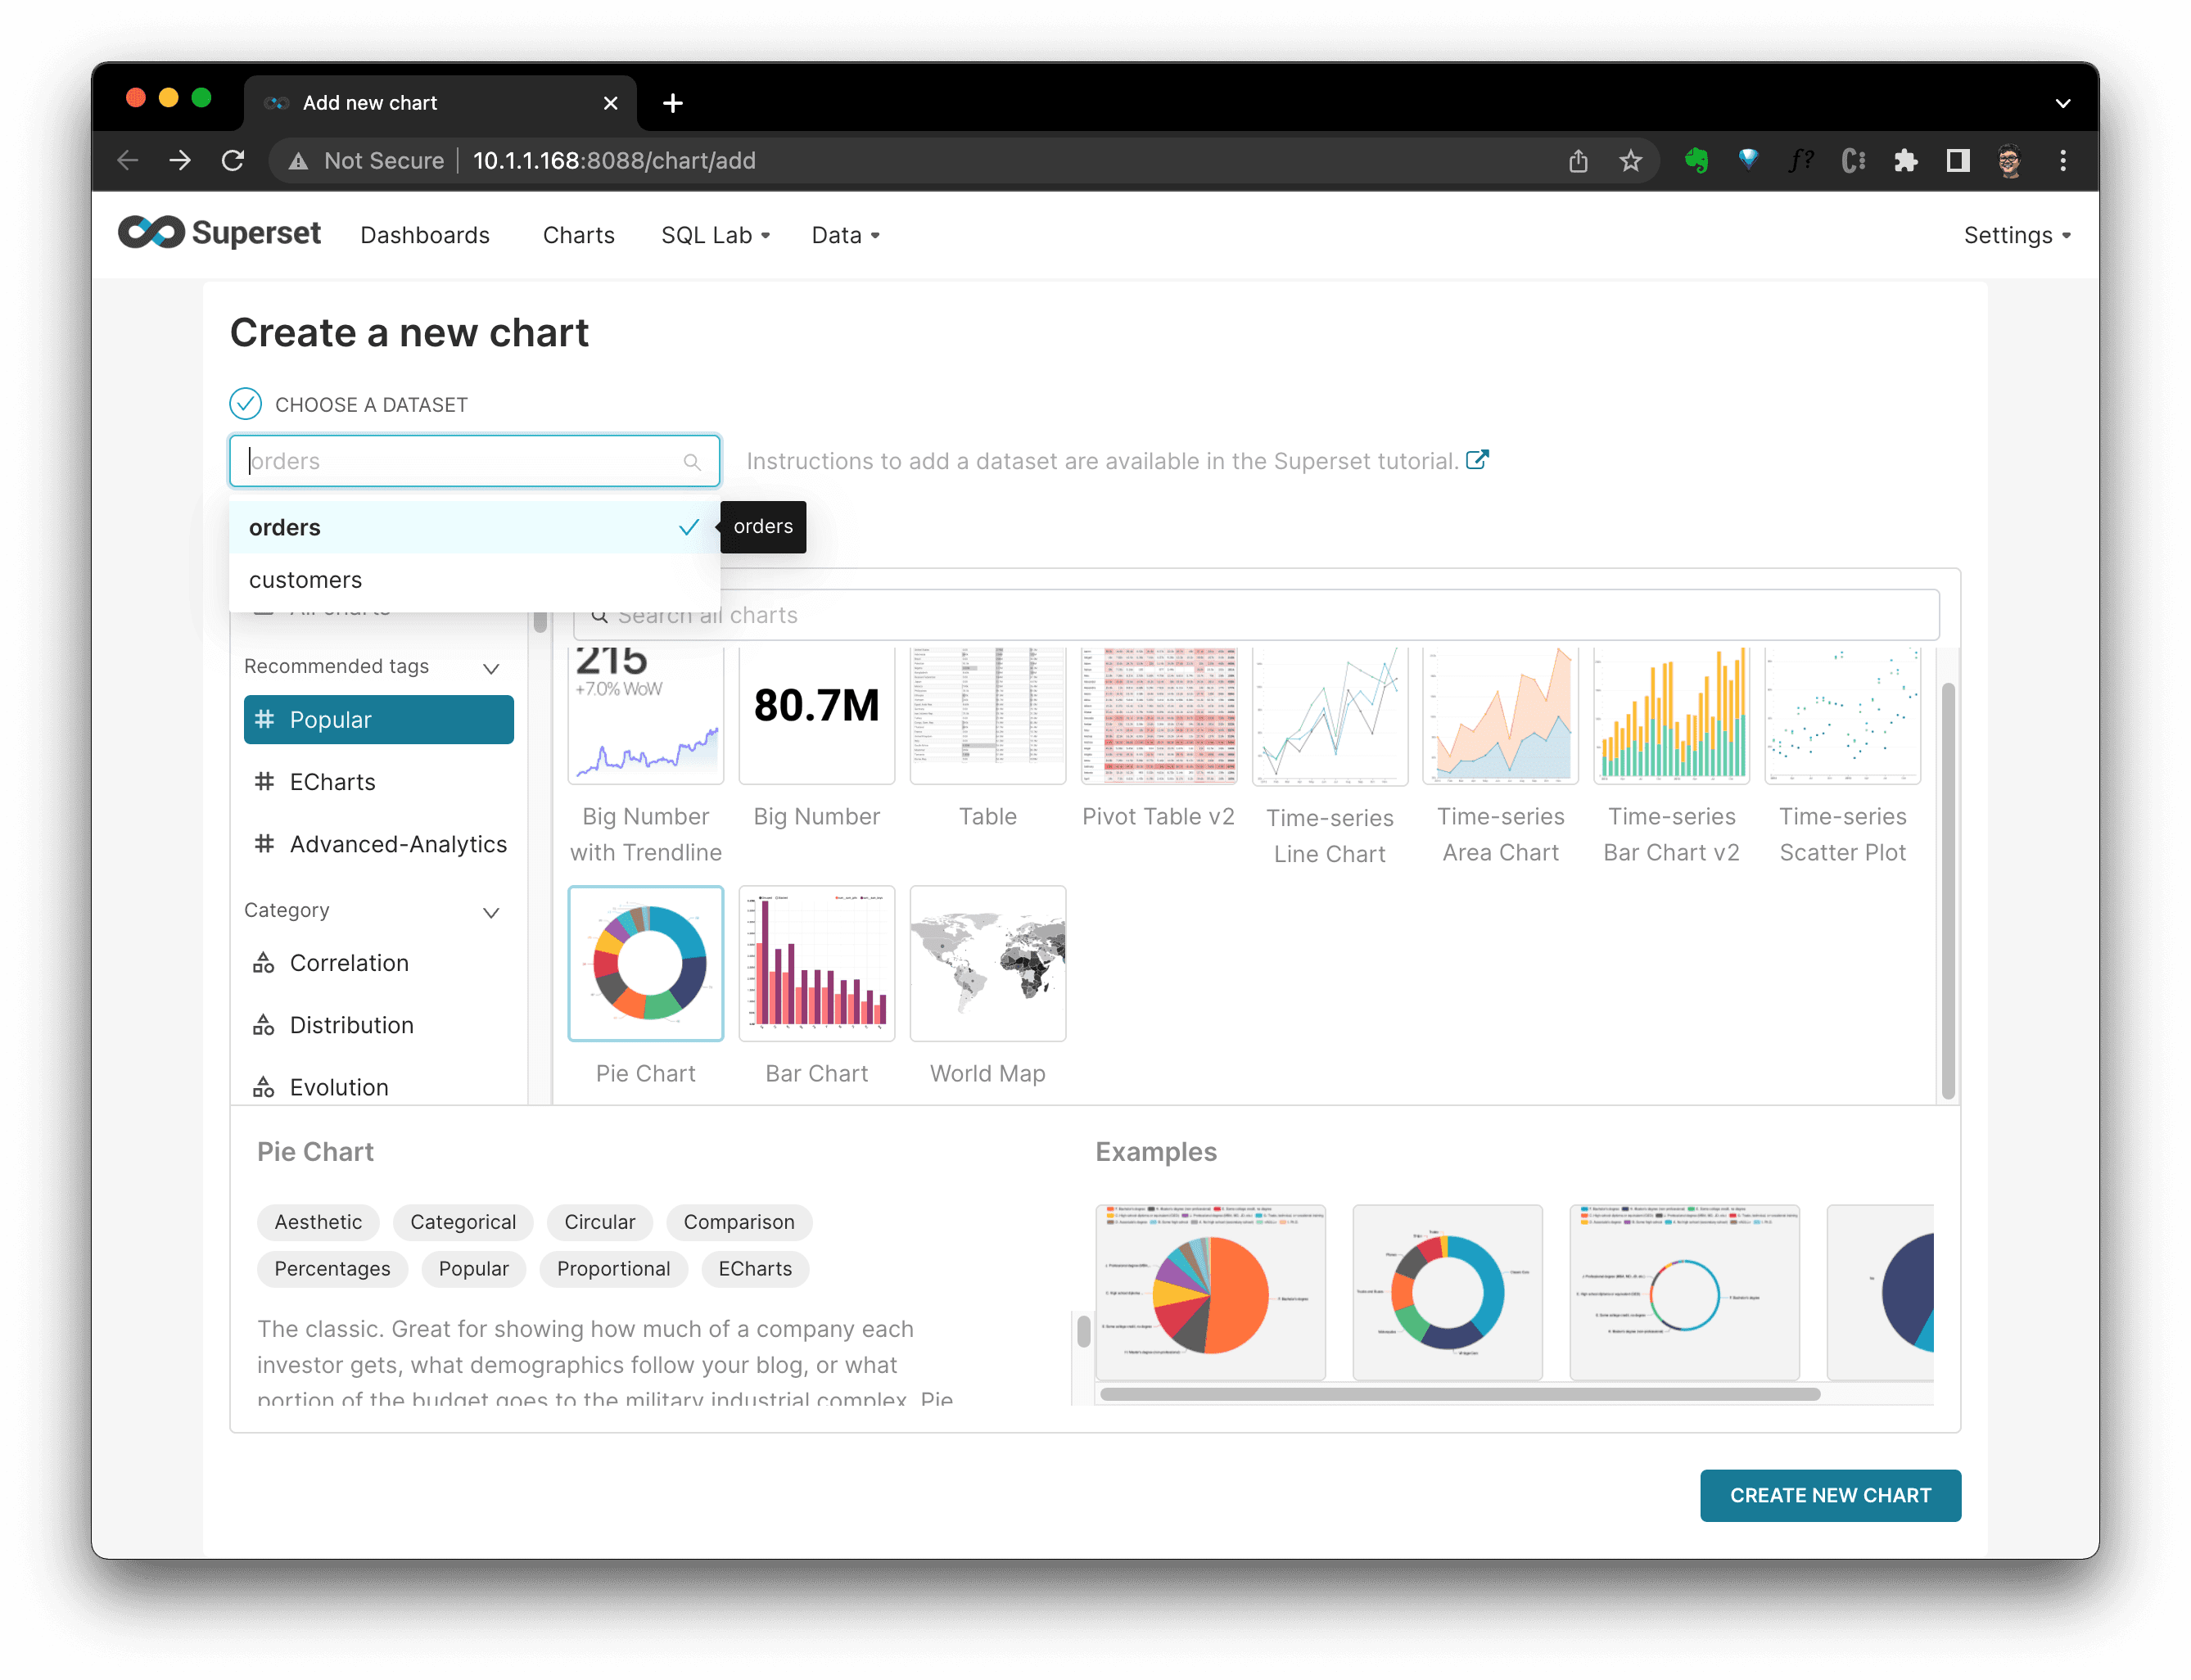
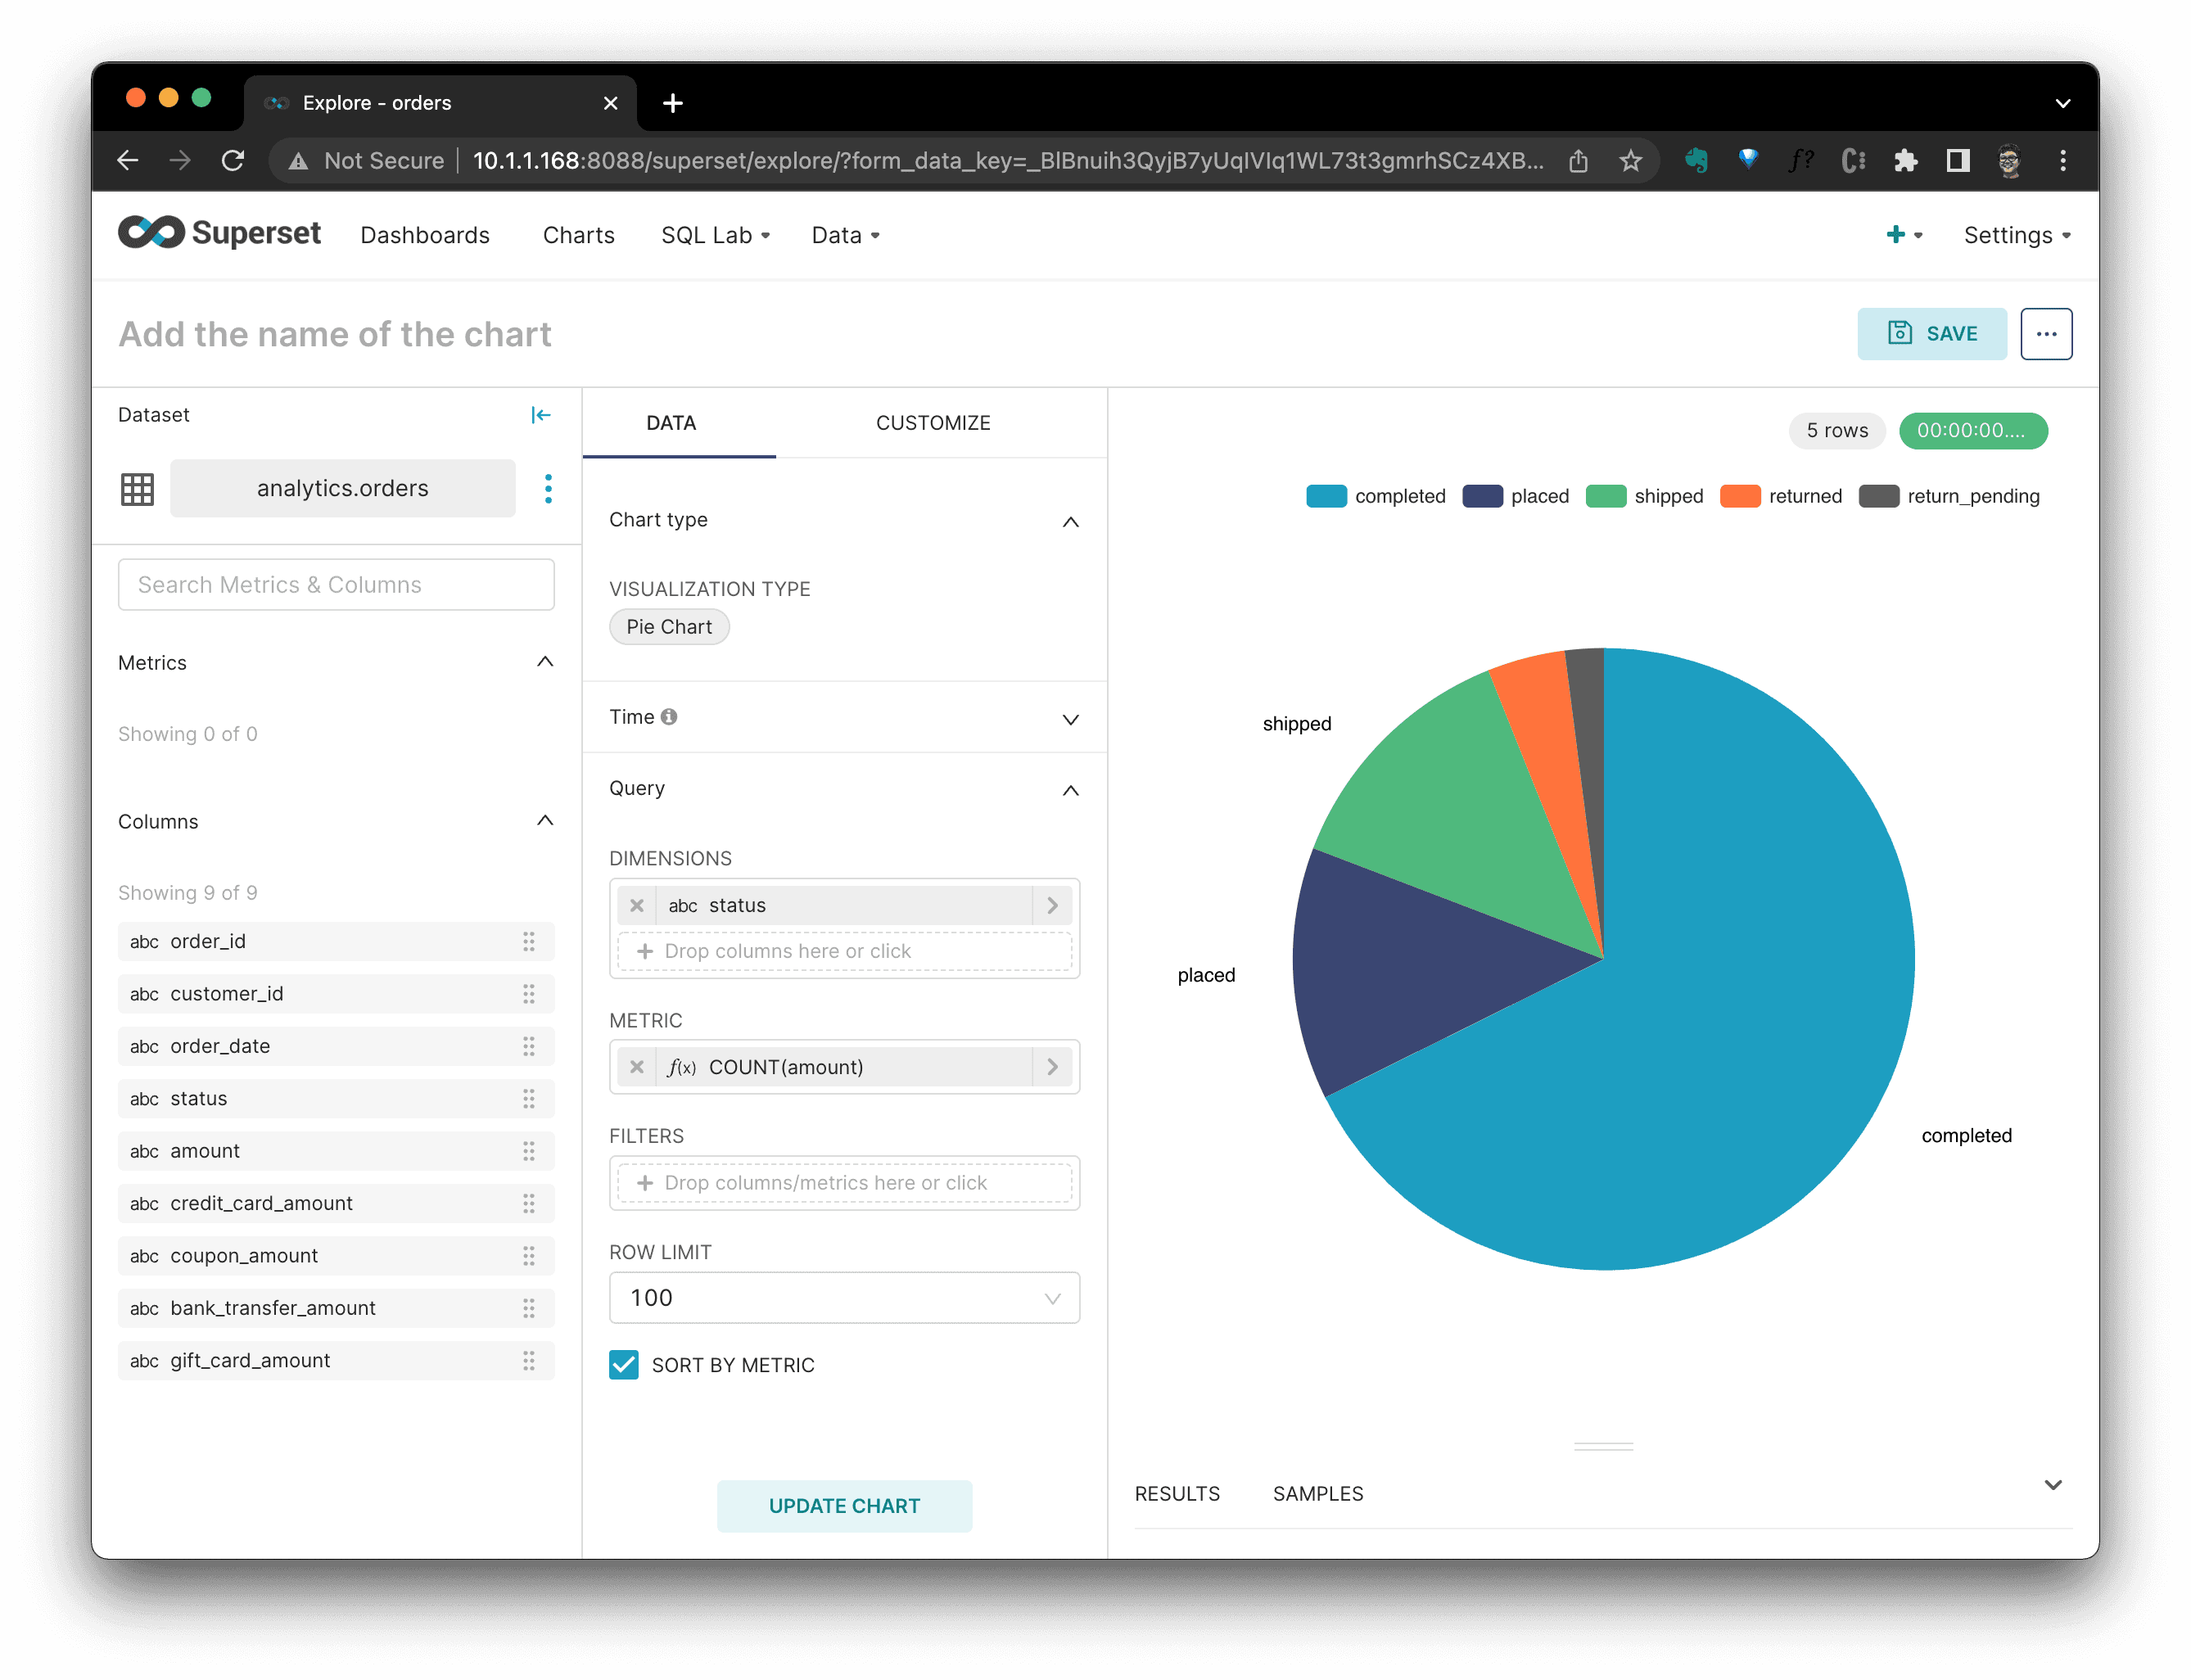
After clicking
CREATE NEW CHART, we are in the chart defination view, where, I selectedQueryofstatusasDIMENSIONS, andCOUNT(amount)asMETRIC. Thus, we could see a Pie Chart per order status's distribution.
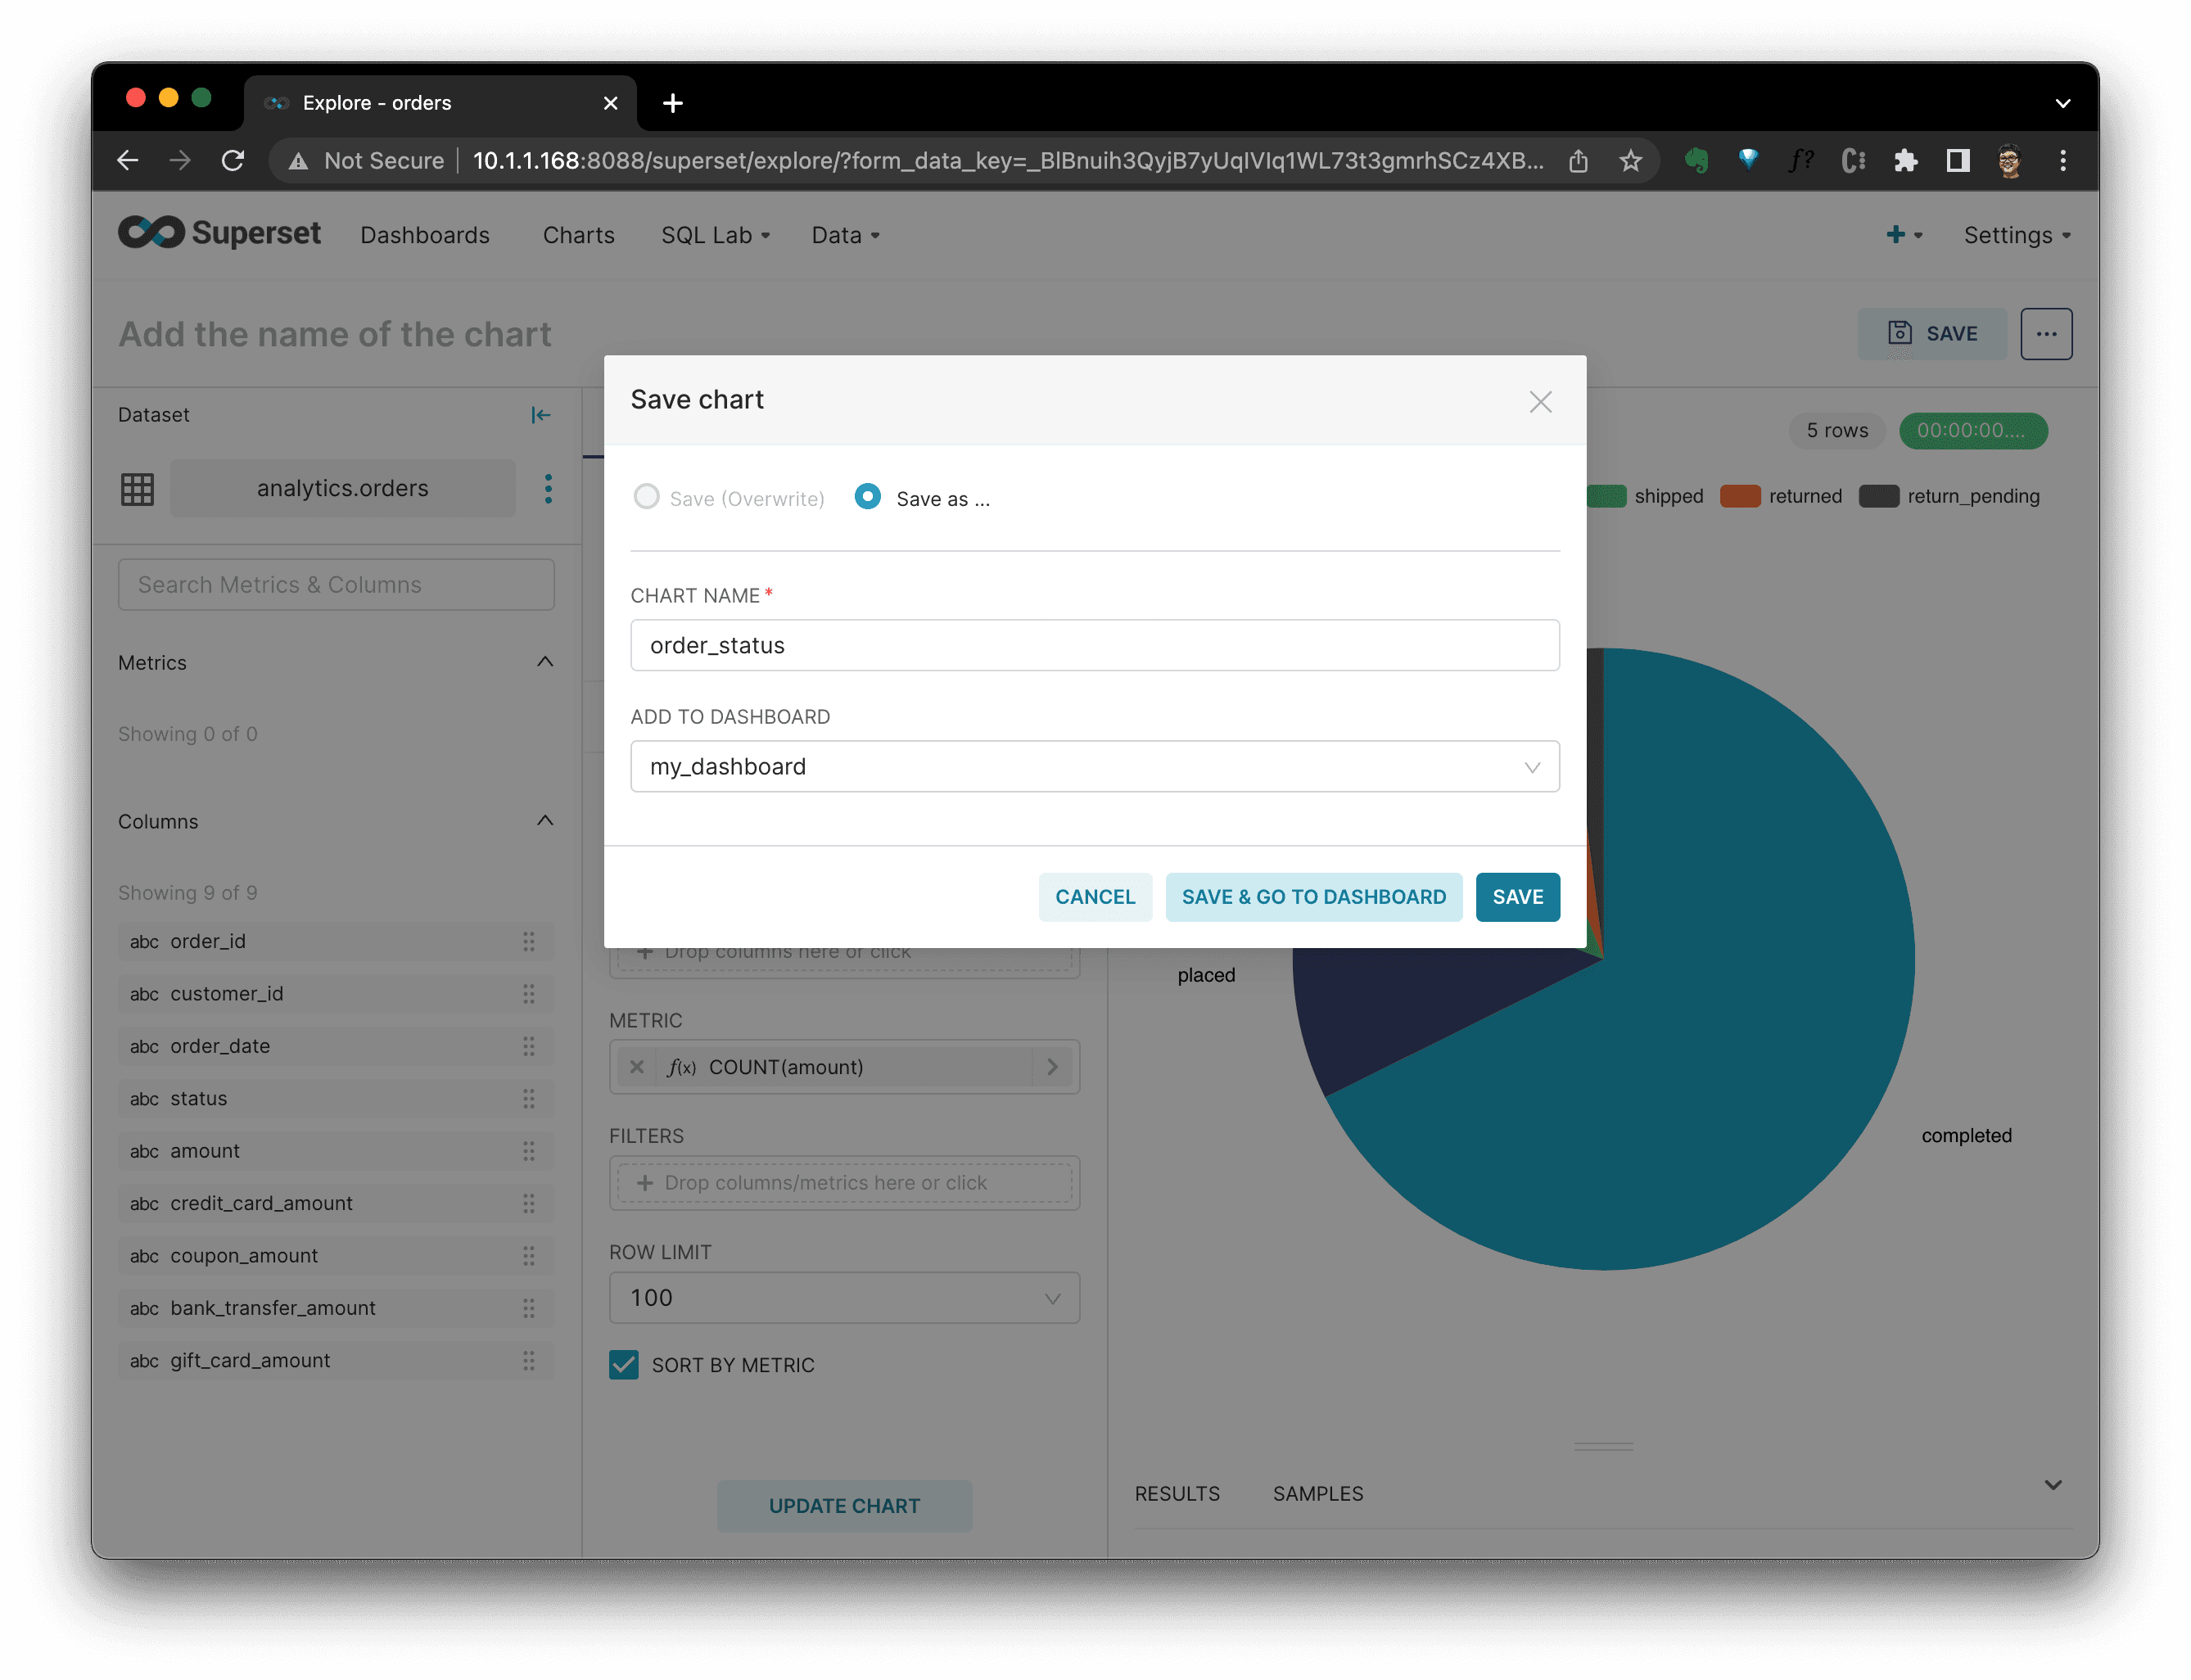
Click
SAVE, it will ask which dashboard this chart should be added to, after it's selected, clickSAVE & GO TO DASHBOARD.
Then, in the dashboard, we coulds see all charts there. You could see that I added another chart showing customer order count distribution, too:
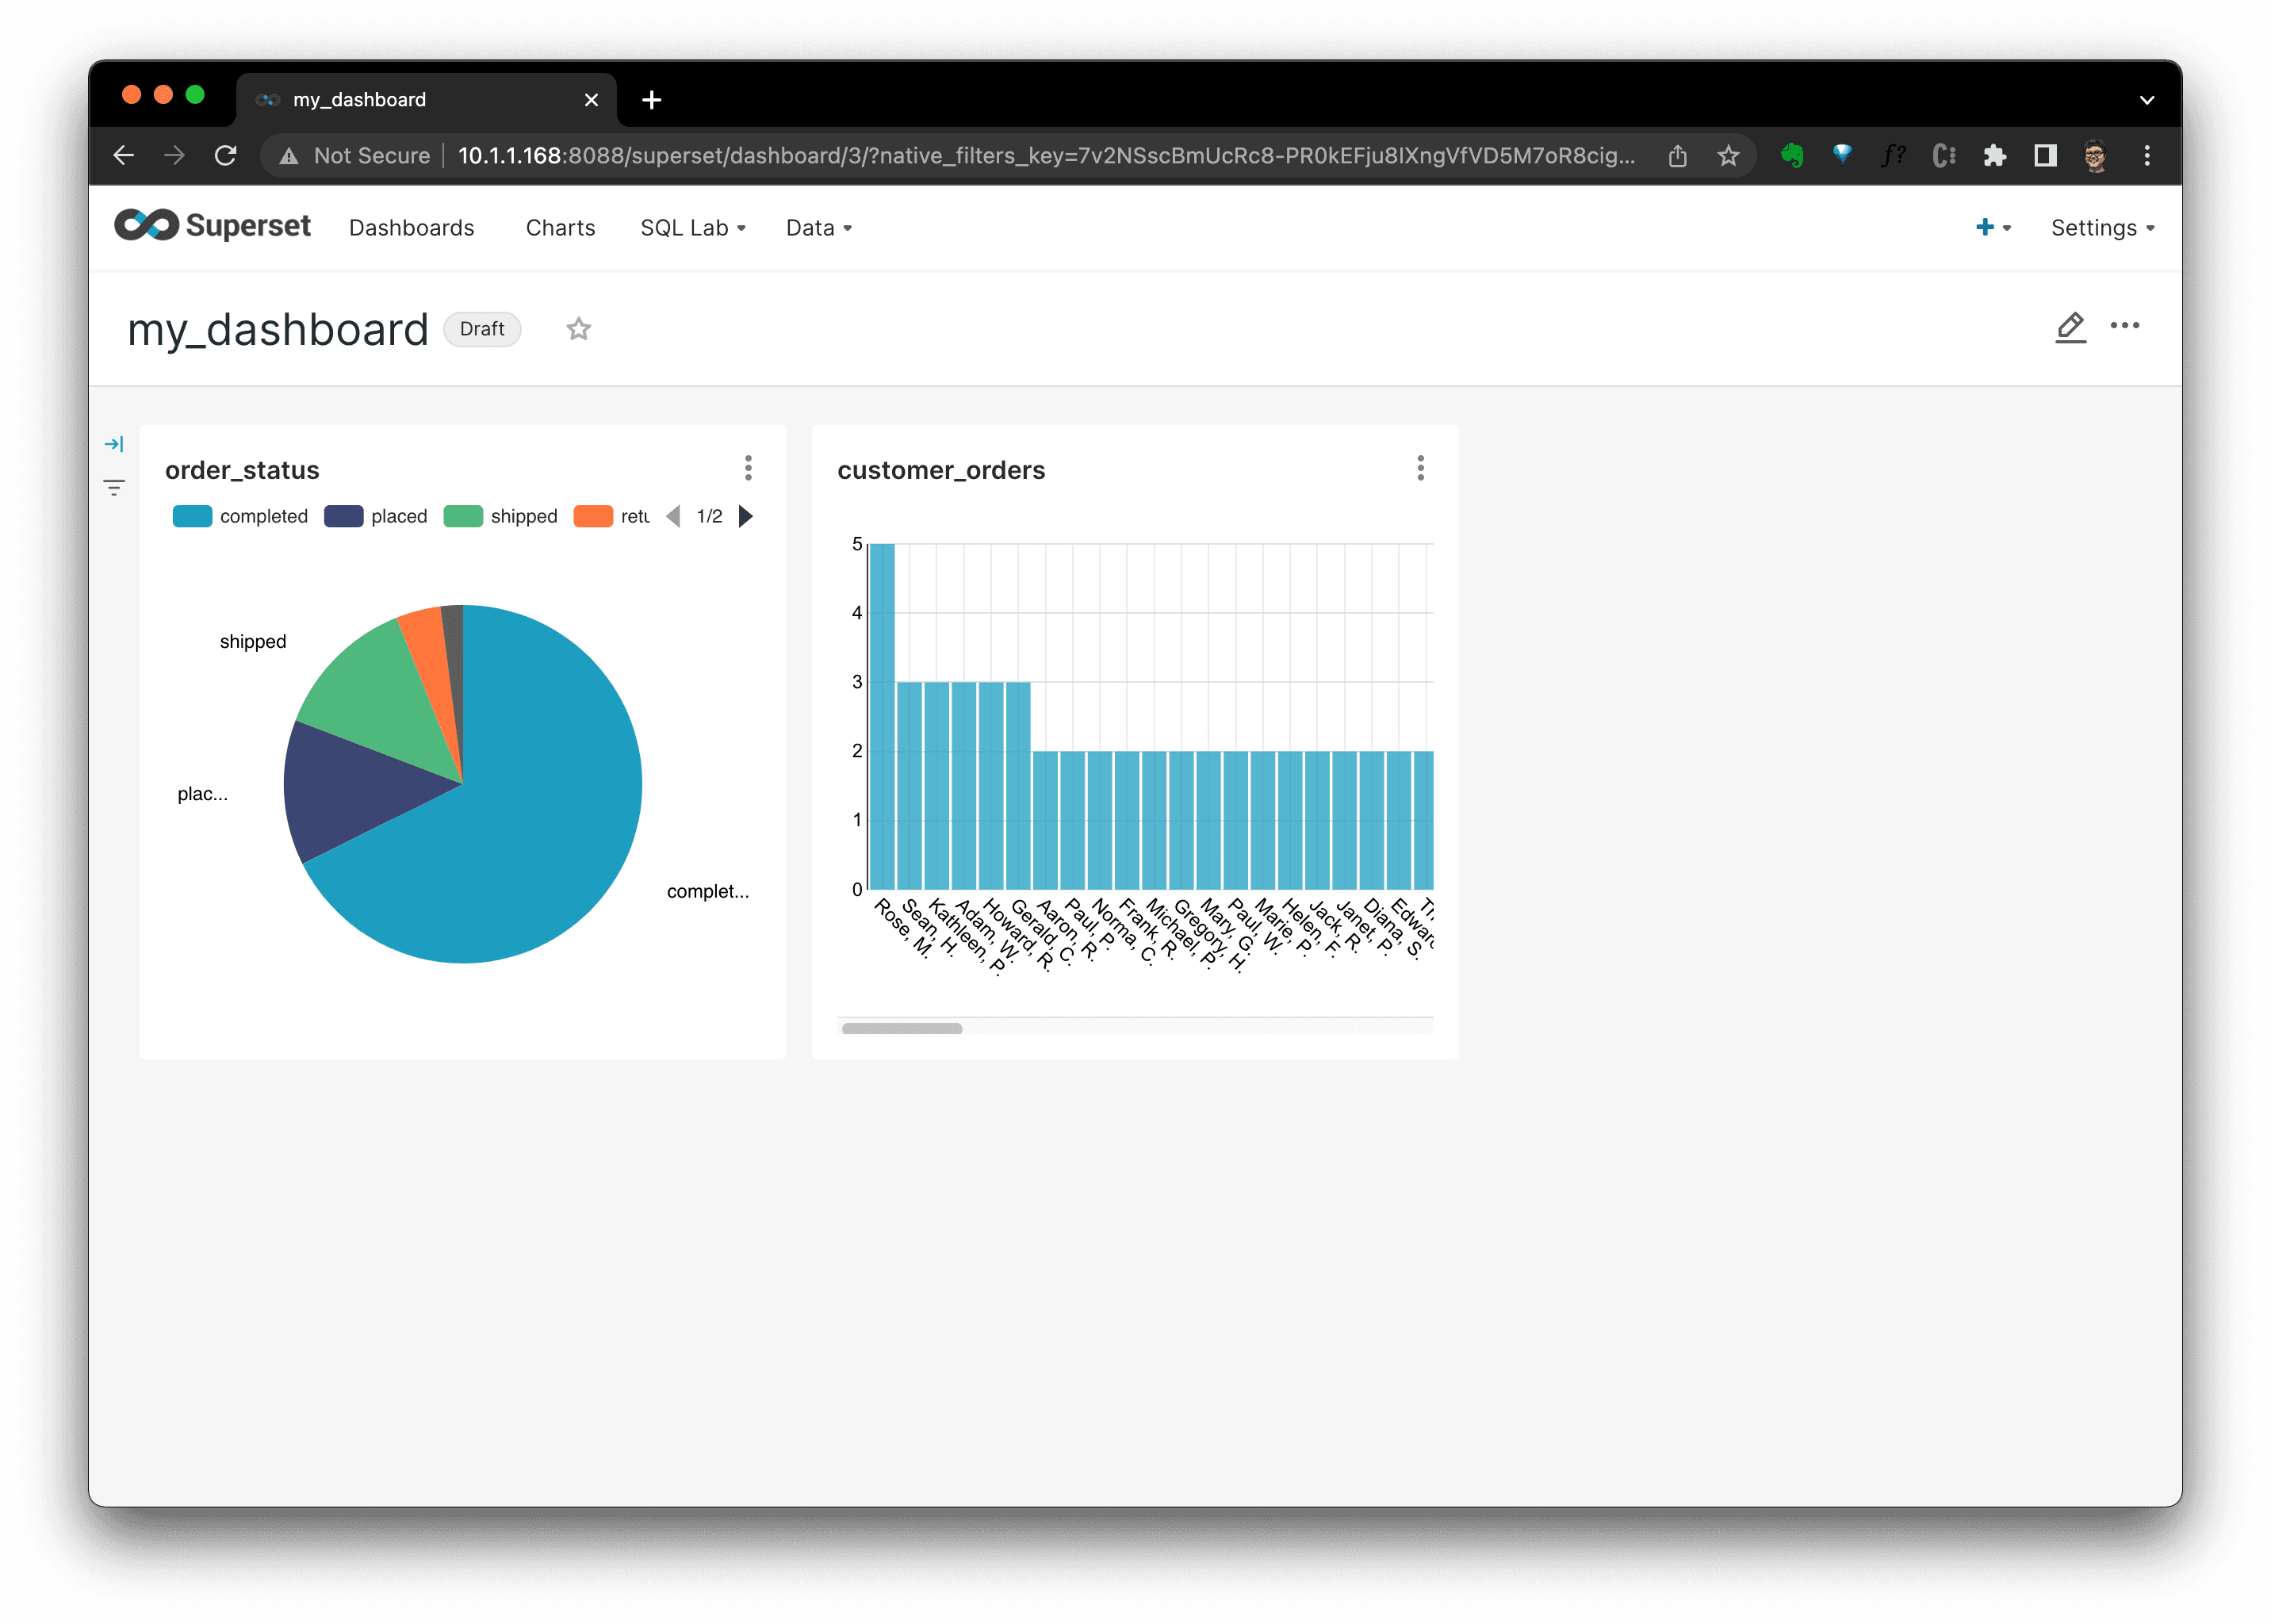
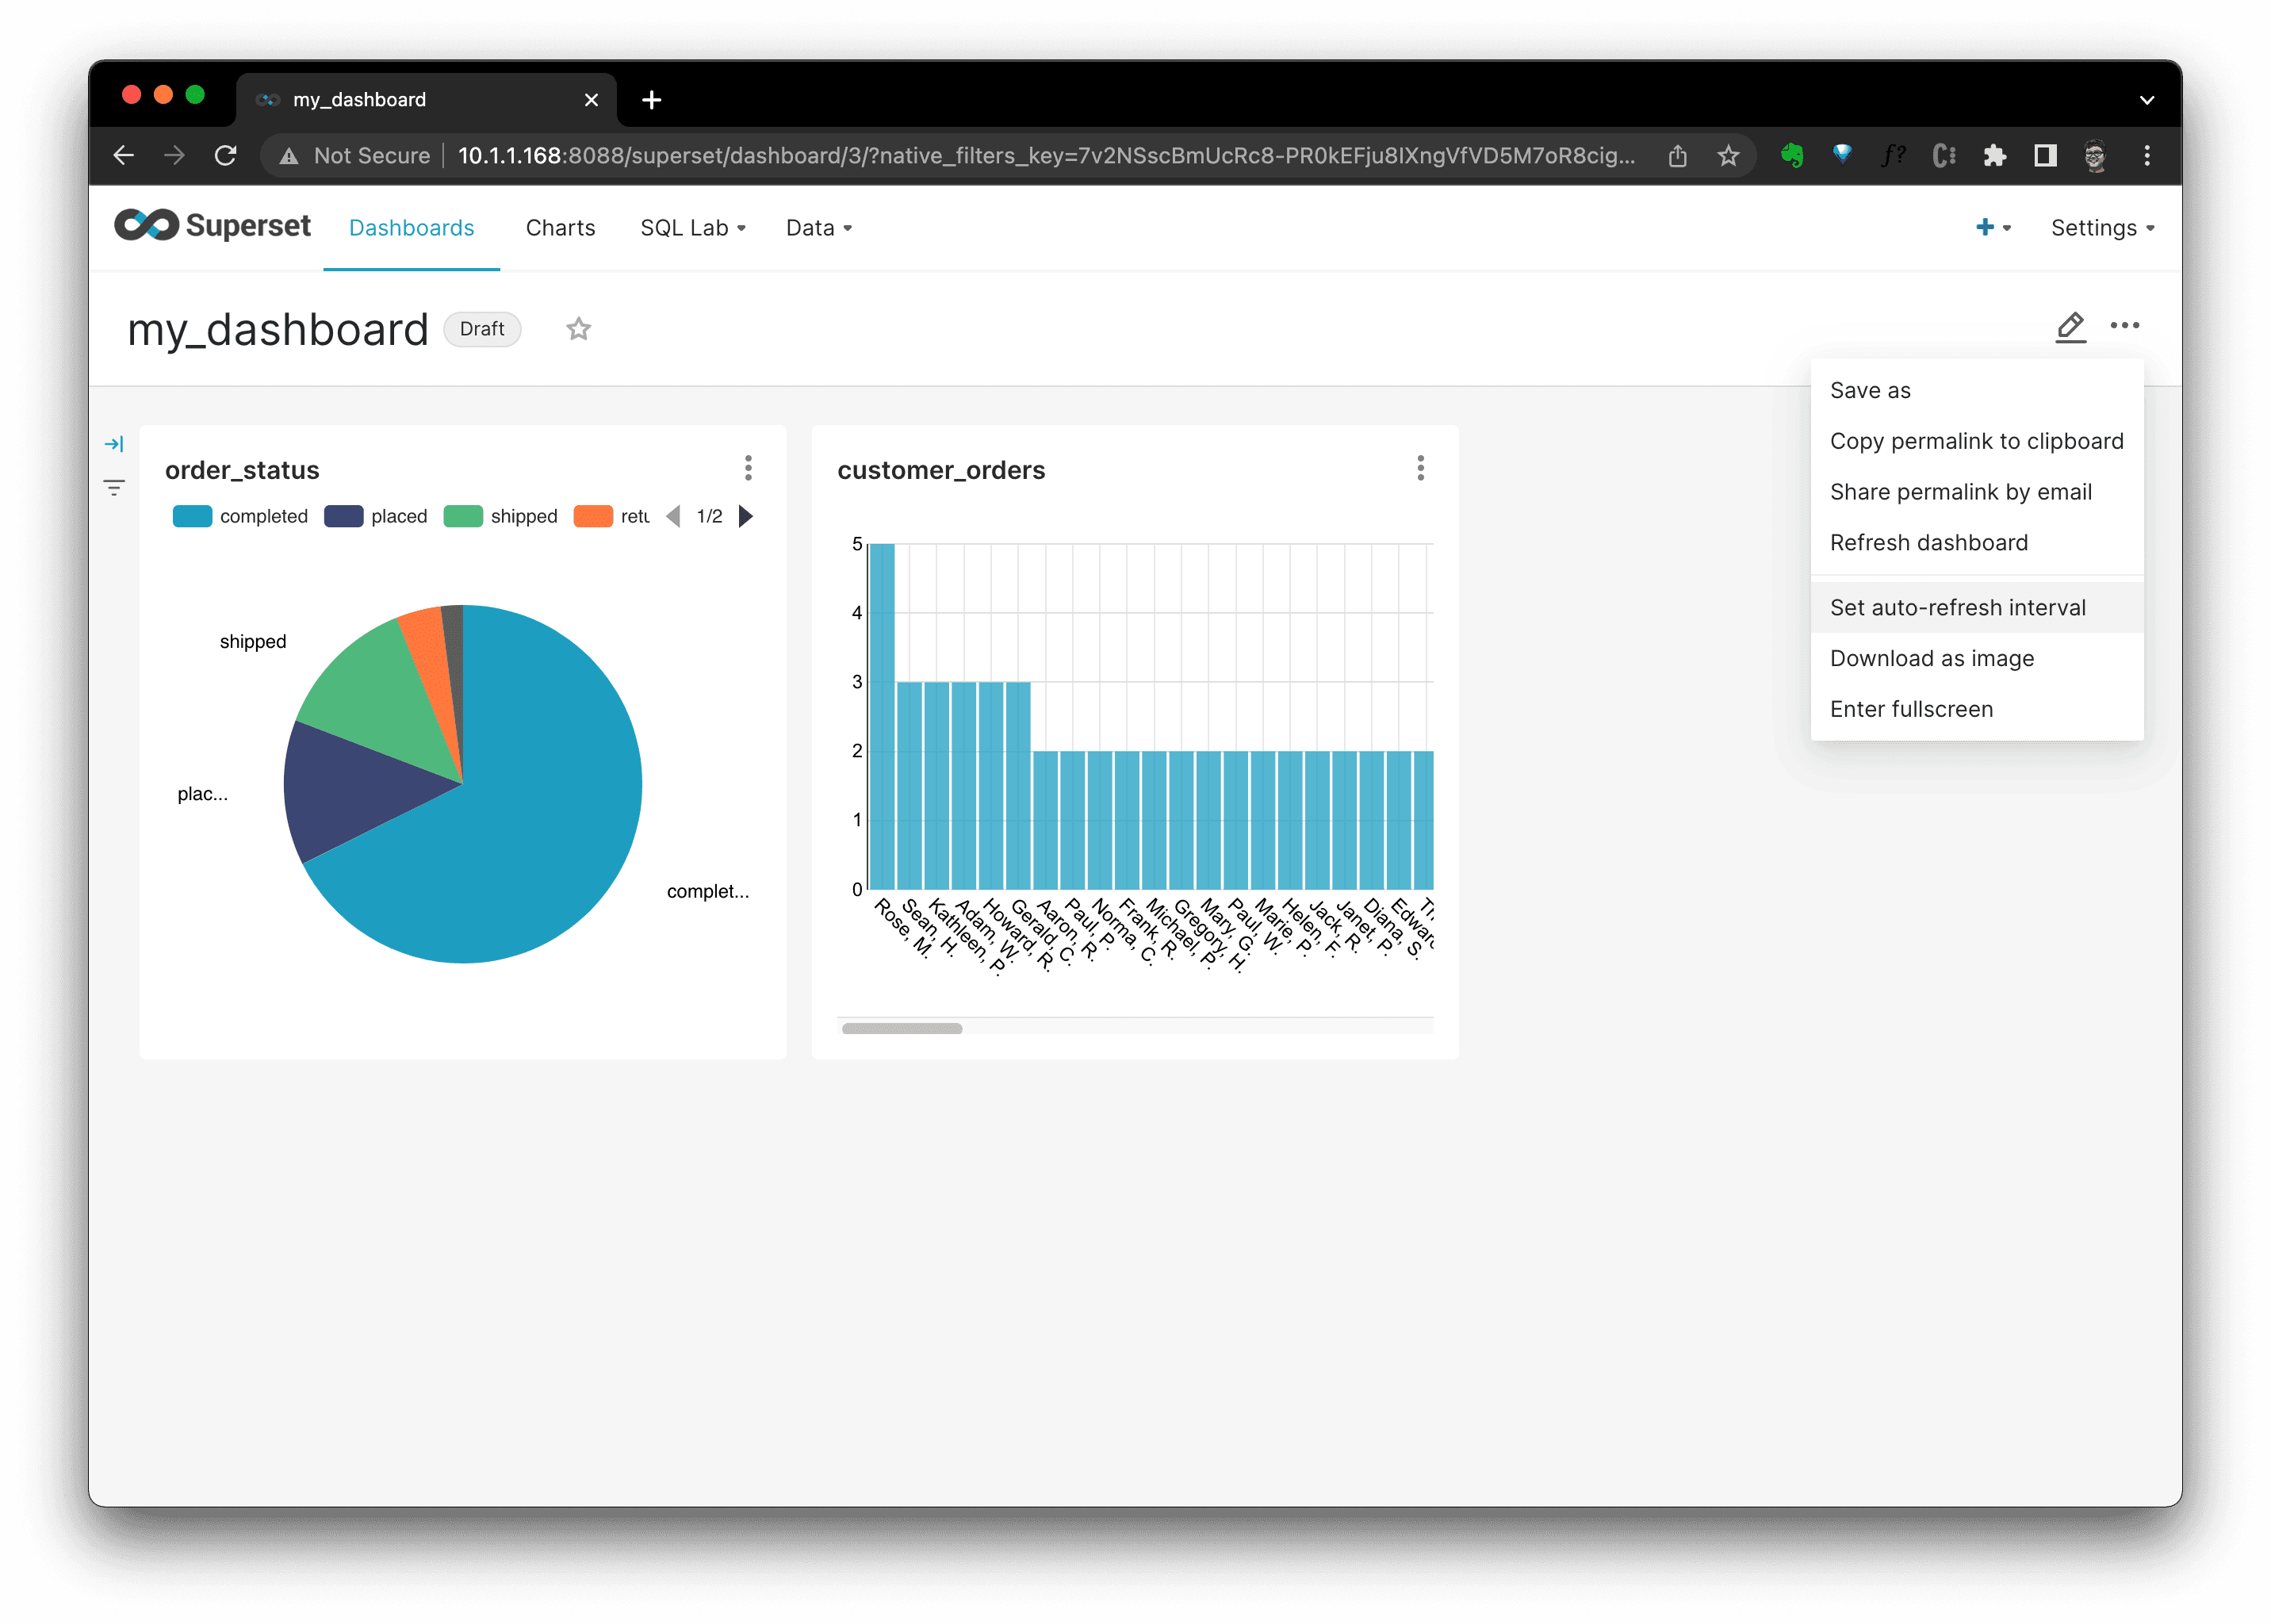
We could set the refresh inteval, or download the dashboard as you wish by clicking the
···button.
It's quite cool, ah? For now, we have a simple but typical data stack like any hobby data lab with everything open-source!
Imagine we have 100 datasets in CSV, 200 tables in Data warehouse and a couple of data engineers running different projects that consume, generate different application, dashboard, and databases. When someone would like to discovery some of those table, dataset, dashboard and pipelines running across them, and then even modify some of them, it's proven to be quite costly in both communicationand engineering.
Here comes the main part of our reference project: Metadata Discovery.
Metadata Discovery
Then, we are stepping to deploy the Amundsen with NebulaGraph and Elasticsearch.
Note: For the time being, the PR NebulaGraph as the Amundsen backend is not yet merged, I am working with the Amundsen team to make it happen.
With Amundsen, we could have all metadata of the whole data stack being discovered and managed in one place. And there are mainly two parts of Amundsen:
Metadata Ingestion
Metadata Catalog
We will be leveraging Data builder to pull metadata from different sources, and persist metadata into the backend storage of the Meta service and the backend storage of the Search service, then we could search, discover and manage them from the Frontend service or through the API of the Metadata service.
Deploy Amundsen
Metadata service
We are going to deploy a cluster of Amundsen with its docker-compose file. As the NebulaGraph backend support is not yet merged, we are referring to my fork.
First, let's clone the repo with all submodules:
Then, start all catalog services and their backend storage:
You could add
-dto put the containers running in the background:And this will stop the cluster:
This will remove the cluster:
Due to this docker-compose file is for developers to play and hack Amundsen easily rather than for production deployment, it's building images from the codebase, which, will take some time for the very first time.
After it's being deployed, please hold on a second before we load some dummy data into its storage with Data builder.
Data builder
Amundsen Data builder is just like a Meltano but for ETL of Metadata to Metadata service and Search service‘s backend storage: NebulaGraph and Elasticsearch. The Data builder here is only a python module and the ETL job could be either run as a script or orchestrated with a DAG platform like Apache Airflow.
With Amundsen Data builder being installed:
Let's call this sample Data builder ETL script to have some dummy data filled in.
Verify Amundsen
Before accessing Amundsen, we need to create a test user:
Then we could view UI at http://localhost:5000 and try to search test, it should return some results.
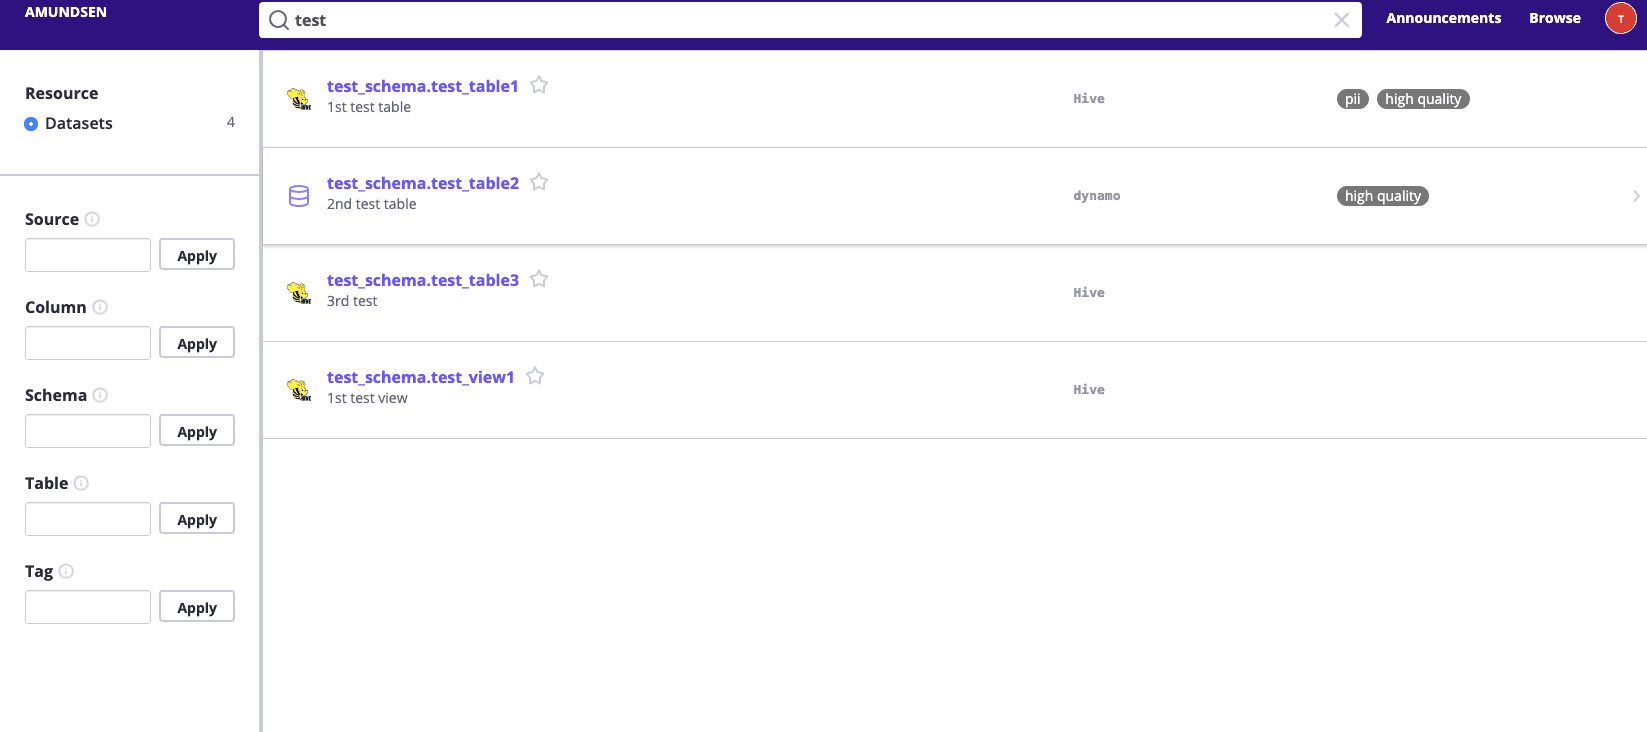
Then you could click and explore those dummy metadata loaded to Amundsen during the sample_data_loader_nebula.py on your own.
Additionally, you could access the Graph Database with Nebula Studio(http://localhost:7001).
Note in Nebula Studio, the default fields to log in will be:
Hosts:
graphd:9669User:
rootPassword:
nebula
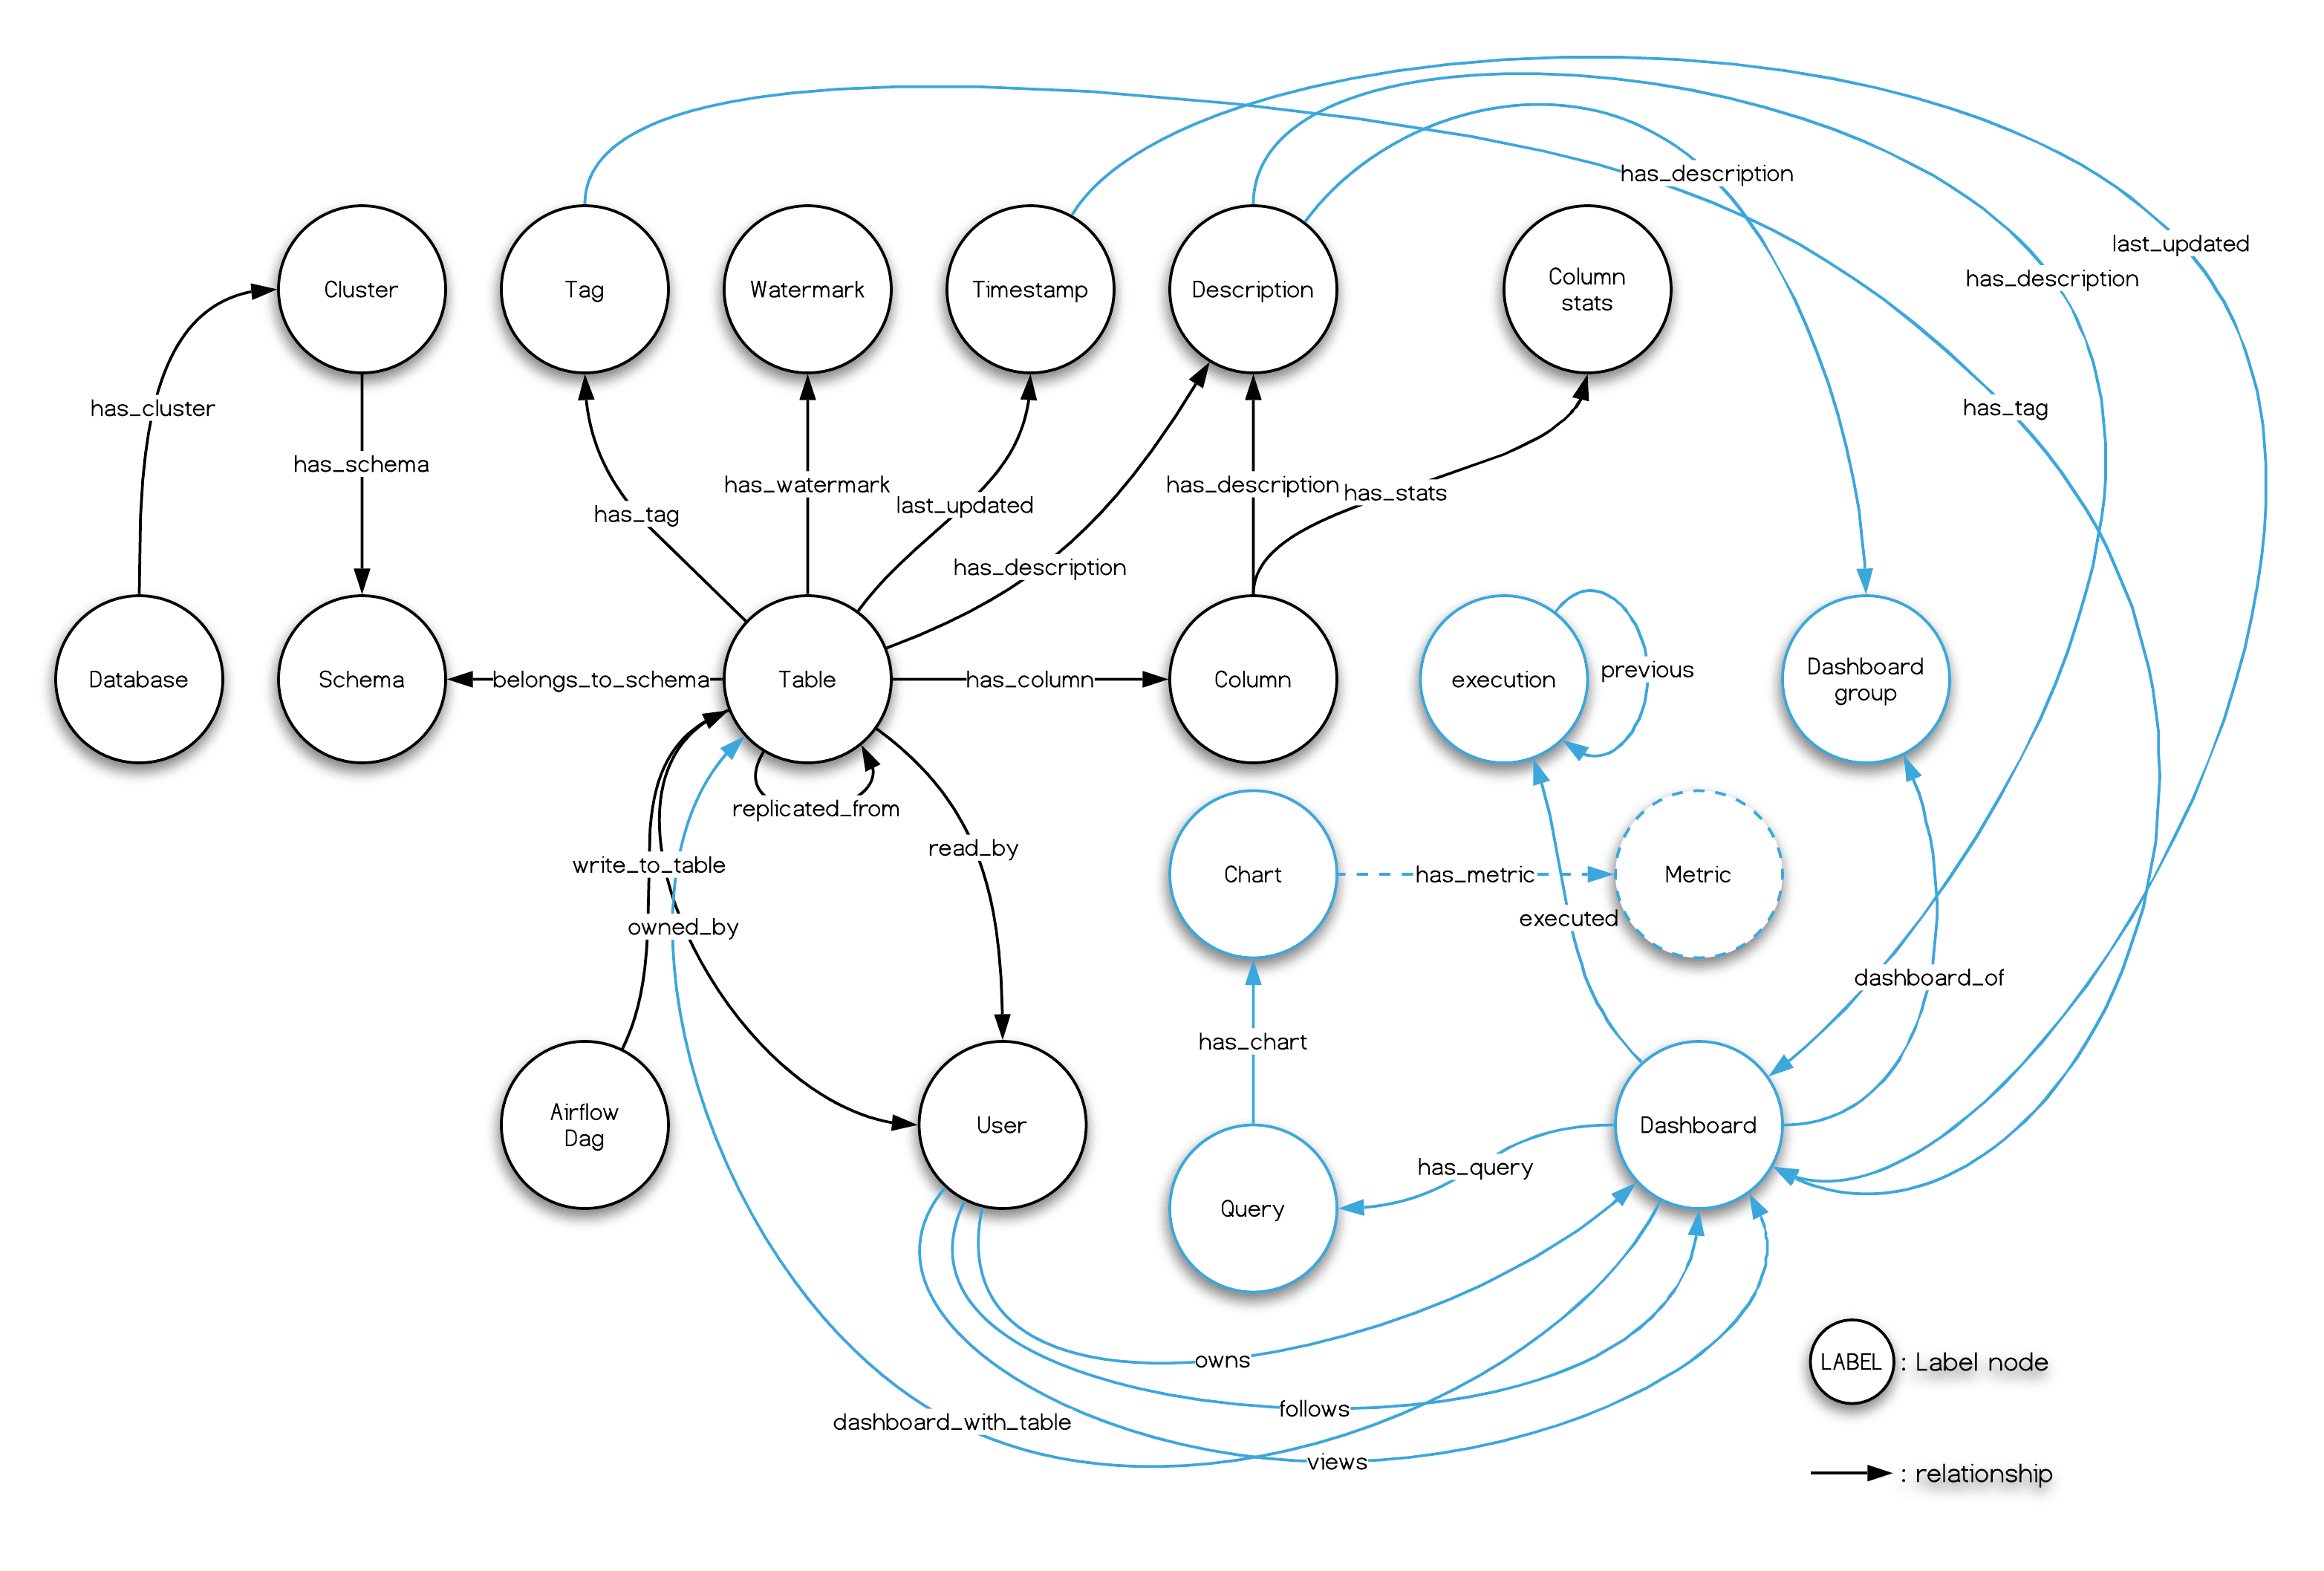
This diagram shows some more details on the components of Amundsen:
Connecting the dots, Metadata Discovery
With the basic environment being set up, let's put everything together.
Remember we had ELT some data to PostgreSQL as this?
How could we let Amundsen discover metadata regarding those data and ETL?
Extracting Postgres metadata
We started on the data source: Postgres, first.
We install the Postgres Client for python3:
Execution of Postgres metadata ETL
Run a script to parse Postgres Metadata:
If you look into the code of the sample script for loading Postgres metadata to Nebula, the main lines are quite straightforward:
The first job was to load data in path:PostgressMetadata --> CSV --> NebulaGraph
PostgresMetadataExtractorwas used to extract/pull metadata from Postgres, refer here for its documentation.FsNebulaCSVLoaderwas used to put extracted data intermediately as CSV filesNebulaCsvPublisherwas used to publish metadata in form of CSV to NebulaGraph
The second job was to load in the path: Metadata stored in NebulaGraph --> Elasticsearch
NebulaSearchDataExtractorwas used to fetch metadata stored in NebulaGraphSearchMetadatatoElasticasearchTaskwas used to make metadata indexed with Elasticsearch.
Note, in production, we could trigger those jobs either in scripts or with an orchestration platform like Apache Airflow.
Verify the Postgres Extraction
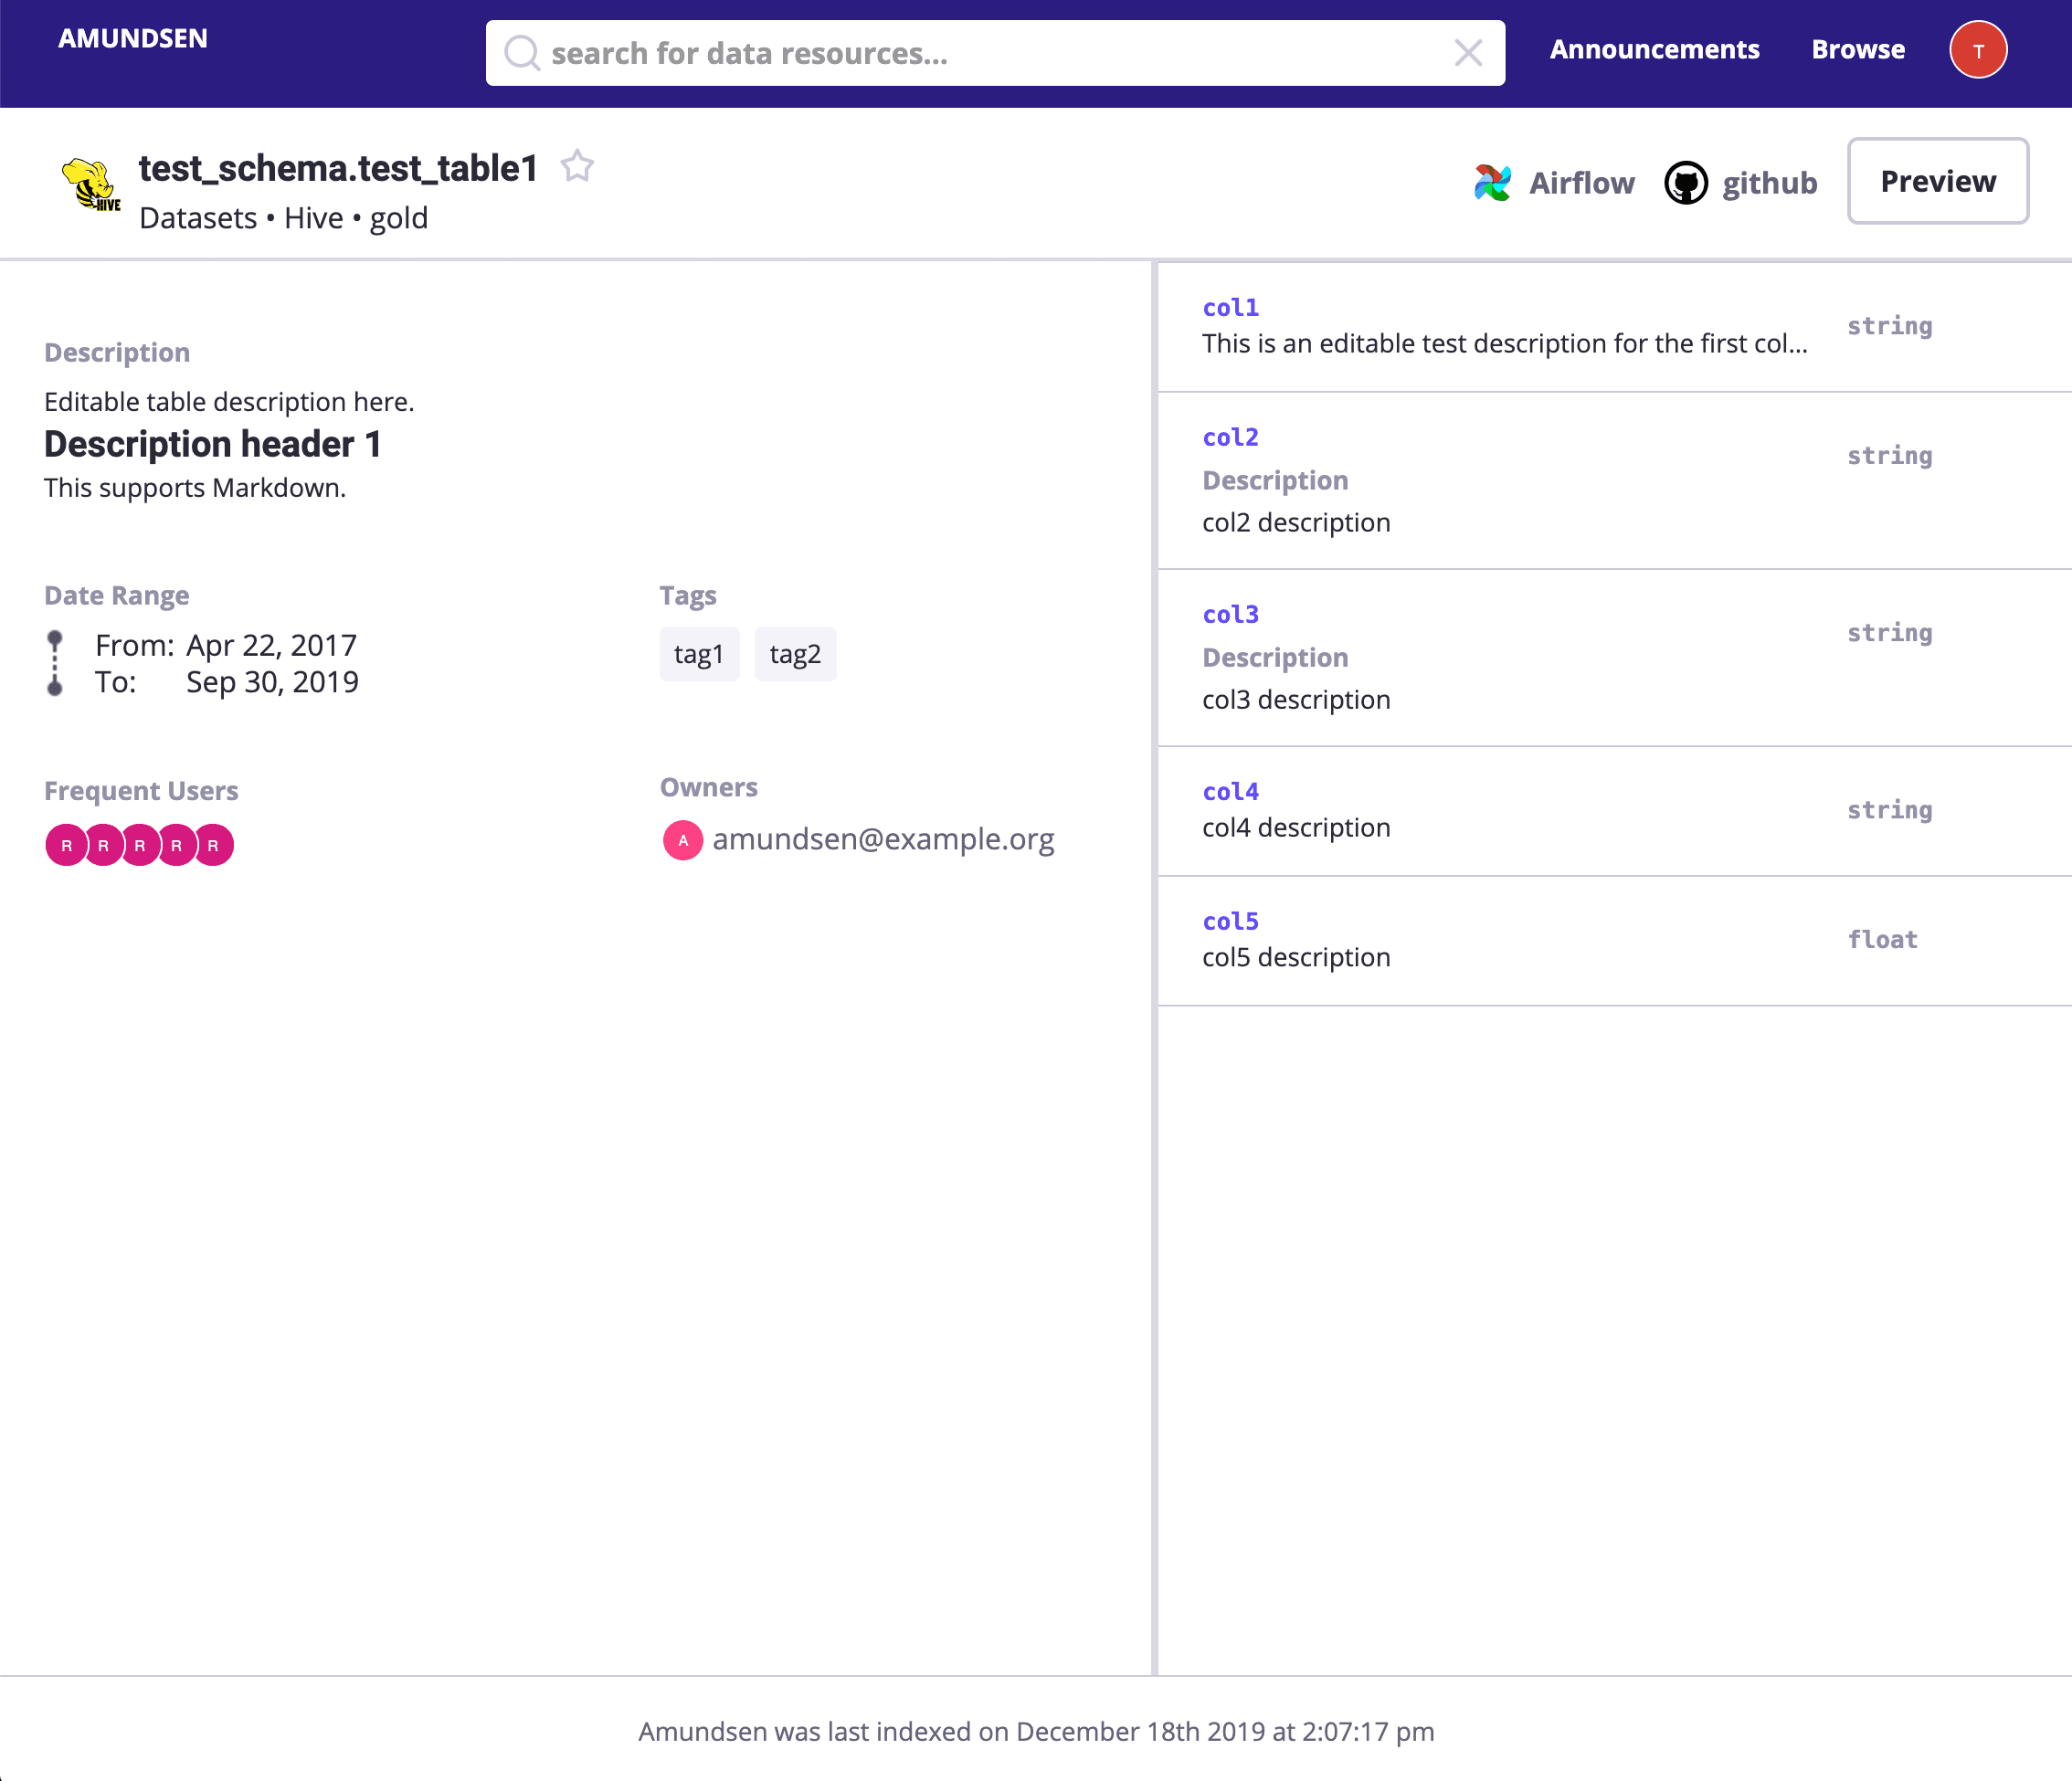
Search payments or directly visit http://localhost:5000/table_detail/warehouse/postgres/public/payments, you could see the metadata from our Postgres like:
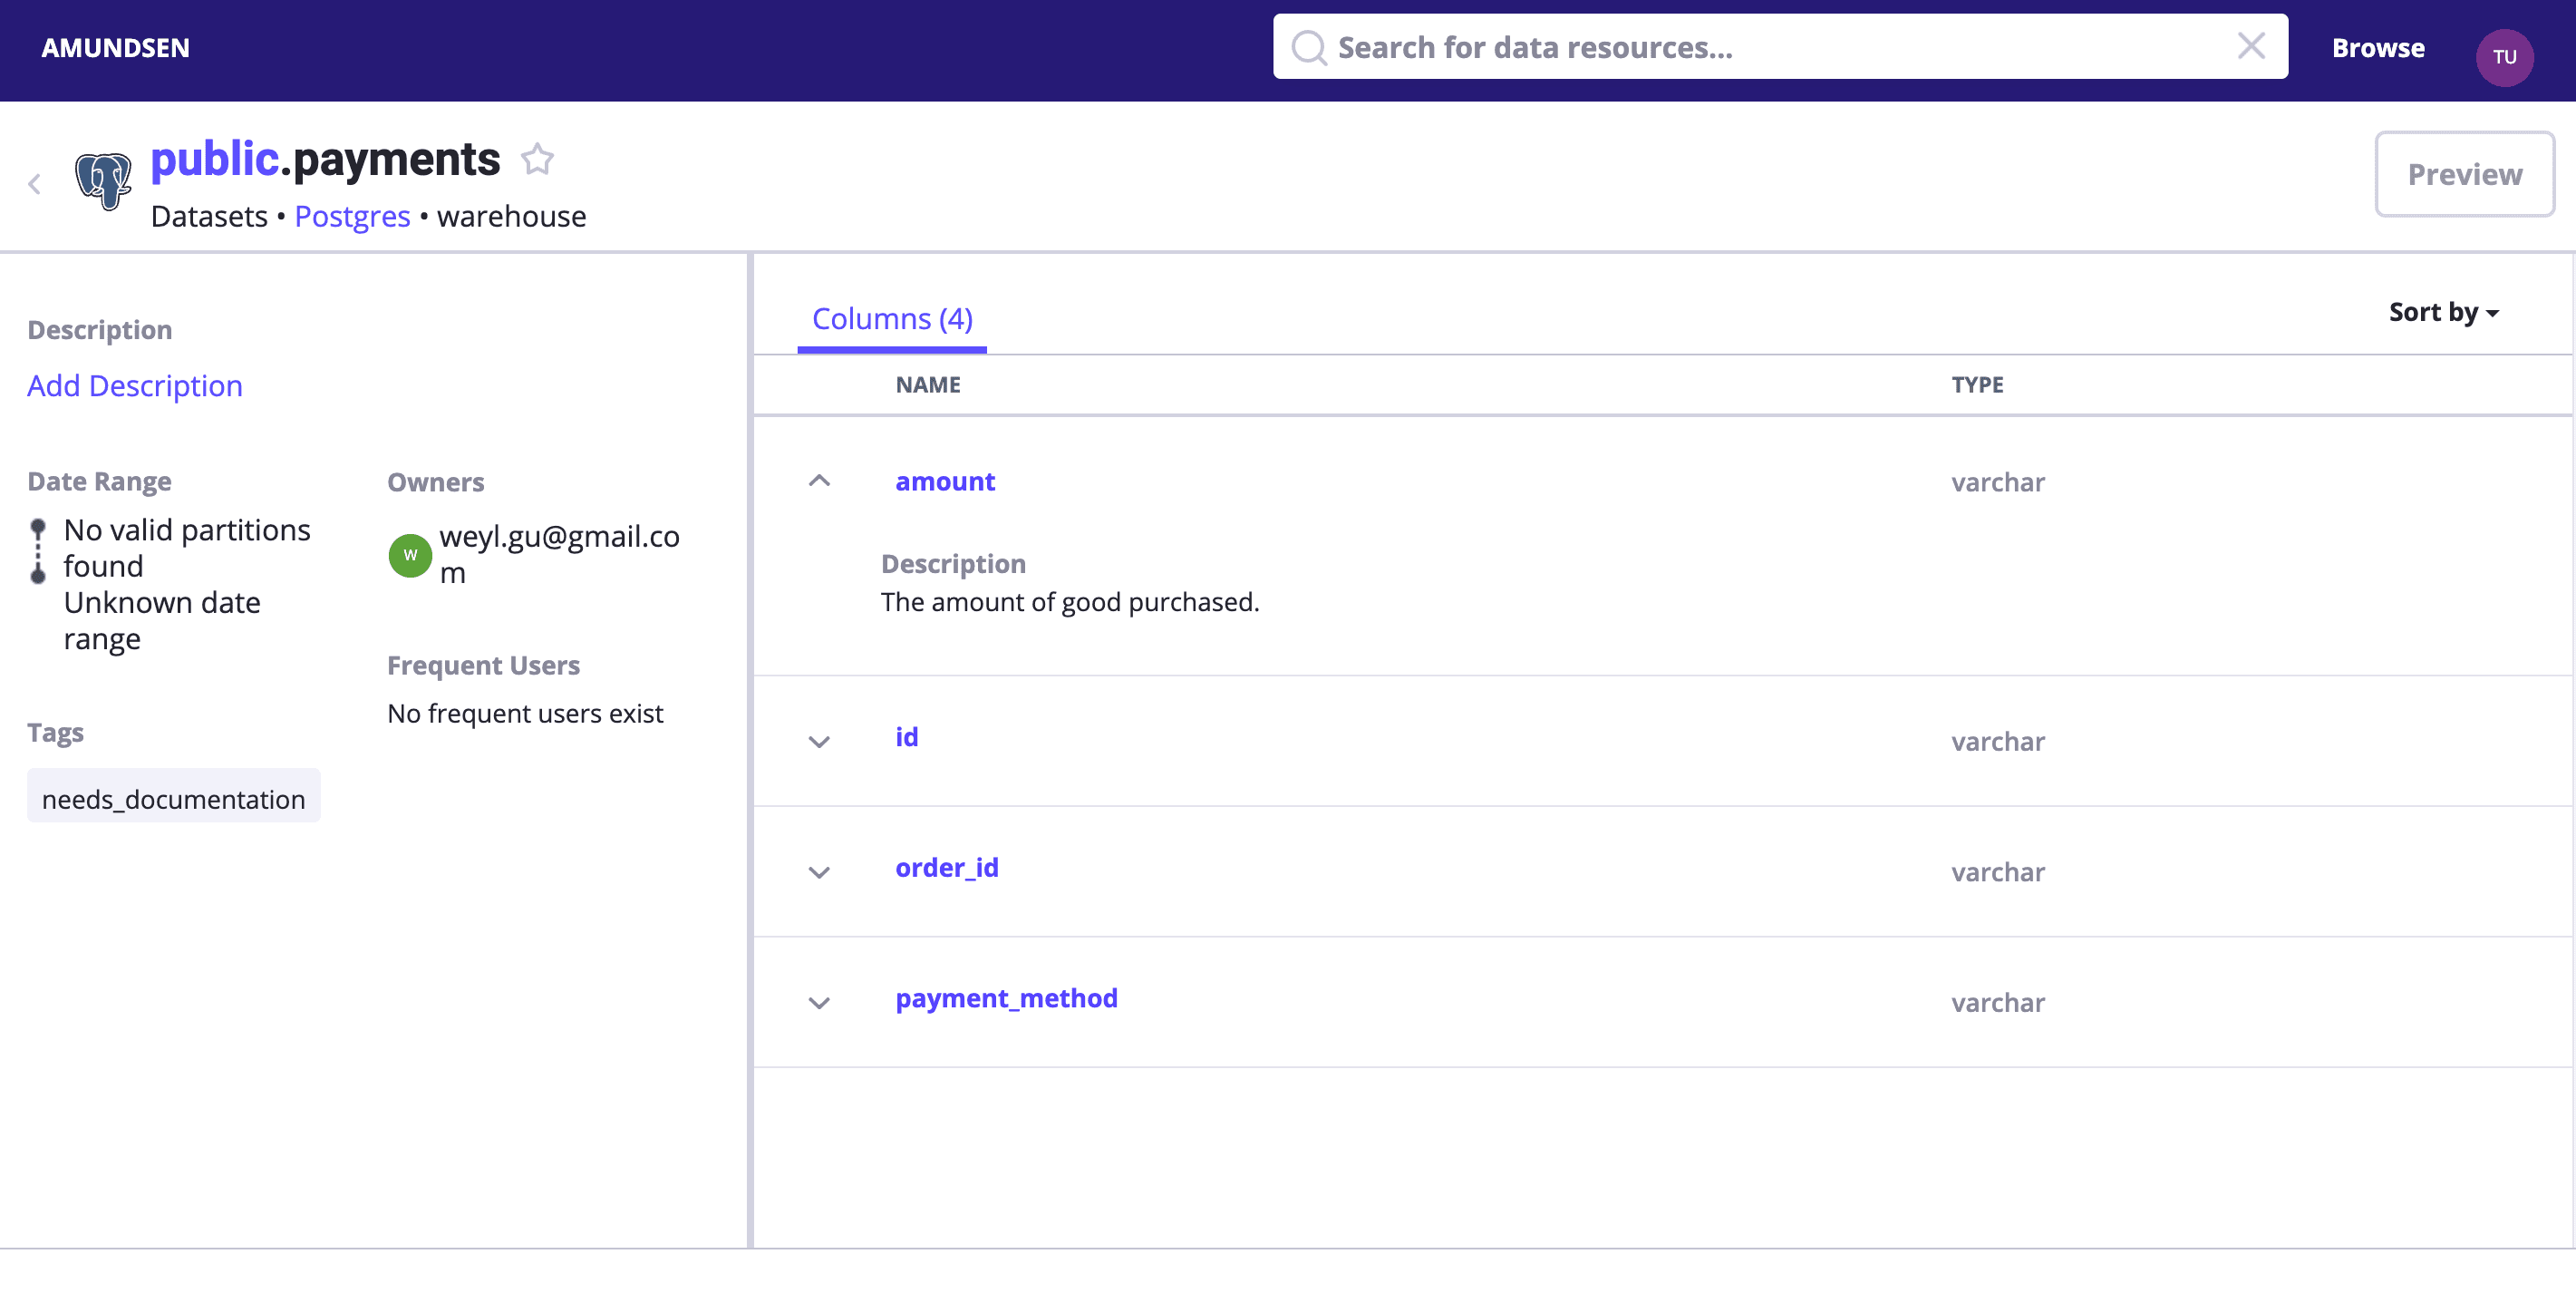
Then, metadata management actions like adding tags, owners, and descriptions could be done easily as it was in the above screen capture, too.
Extracting dbt metadata
Actually, we could also pull metadata from dbt itself.
The Amundsen DbtExtractor, will parse the catalog.json or manifest.json file to load metadata to Amundsen storage(NebulaGraph and Elasticsearch).
In above meltano chapter, we had already generated that file with meltano invoke dbt docs generate, and the output like the following is telling us the catalog.json file:
Execution of dbt metadata ETL
There is an example script with a sample dbt output files:
The sample dbt files:
We could load this sample dbt manifest with:
From this lines of python code, we could tell those process as:
And the only differences from the Postgres meta ETL is the extractor=DbtExtractor(), where it comes with following confiugrations to get below information regarding dbt projects:
databases_name
catalog_json
manifest_json
Verify the dbt Extraction
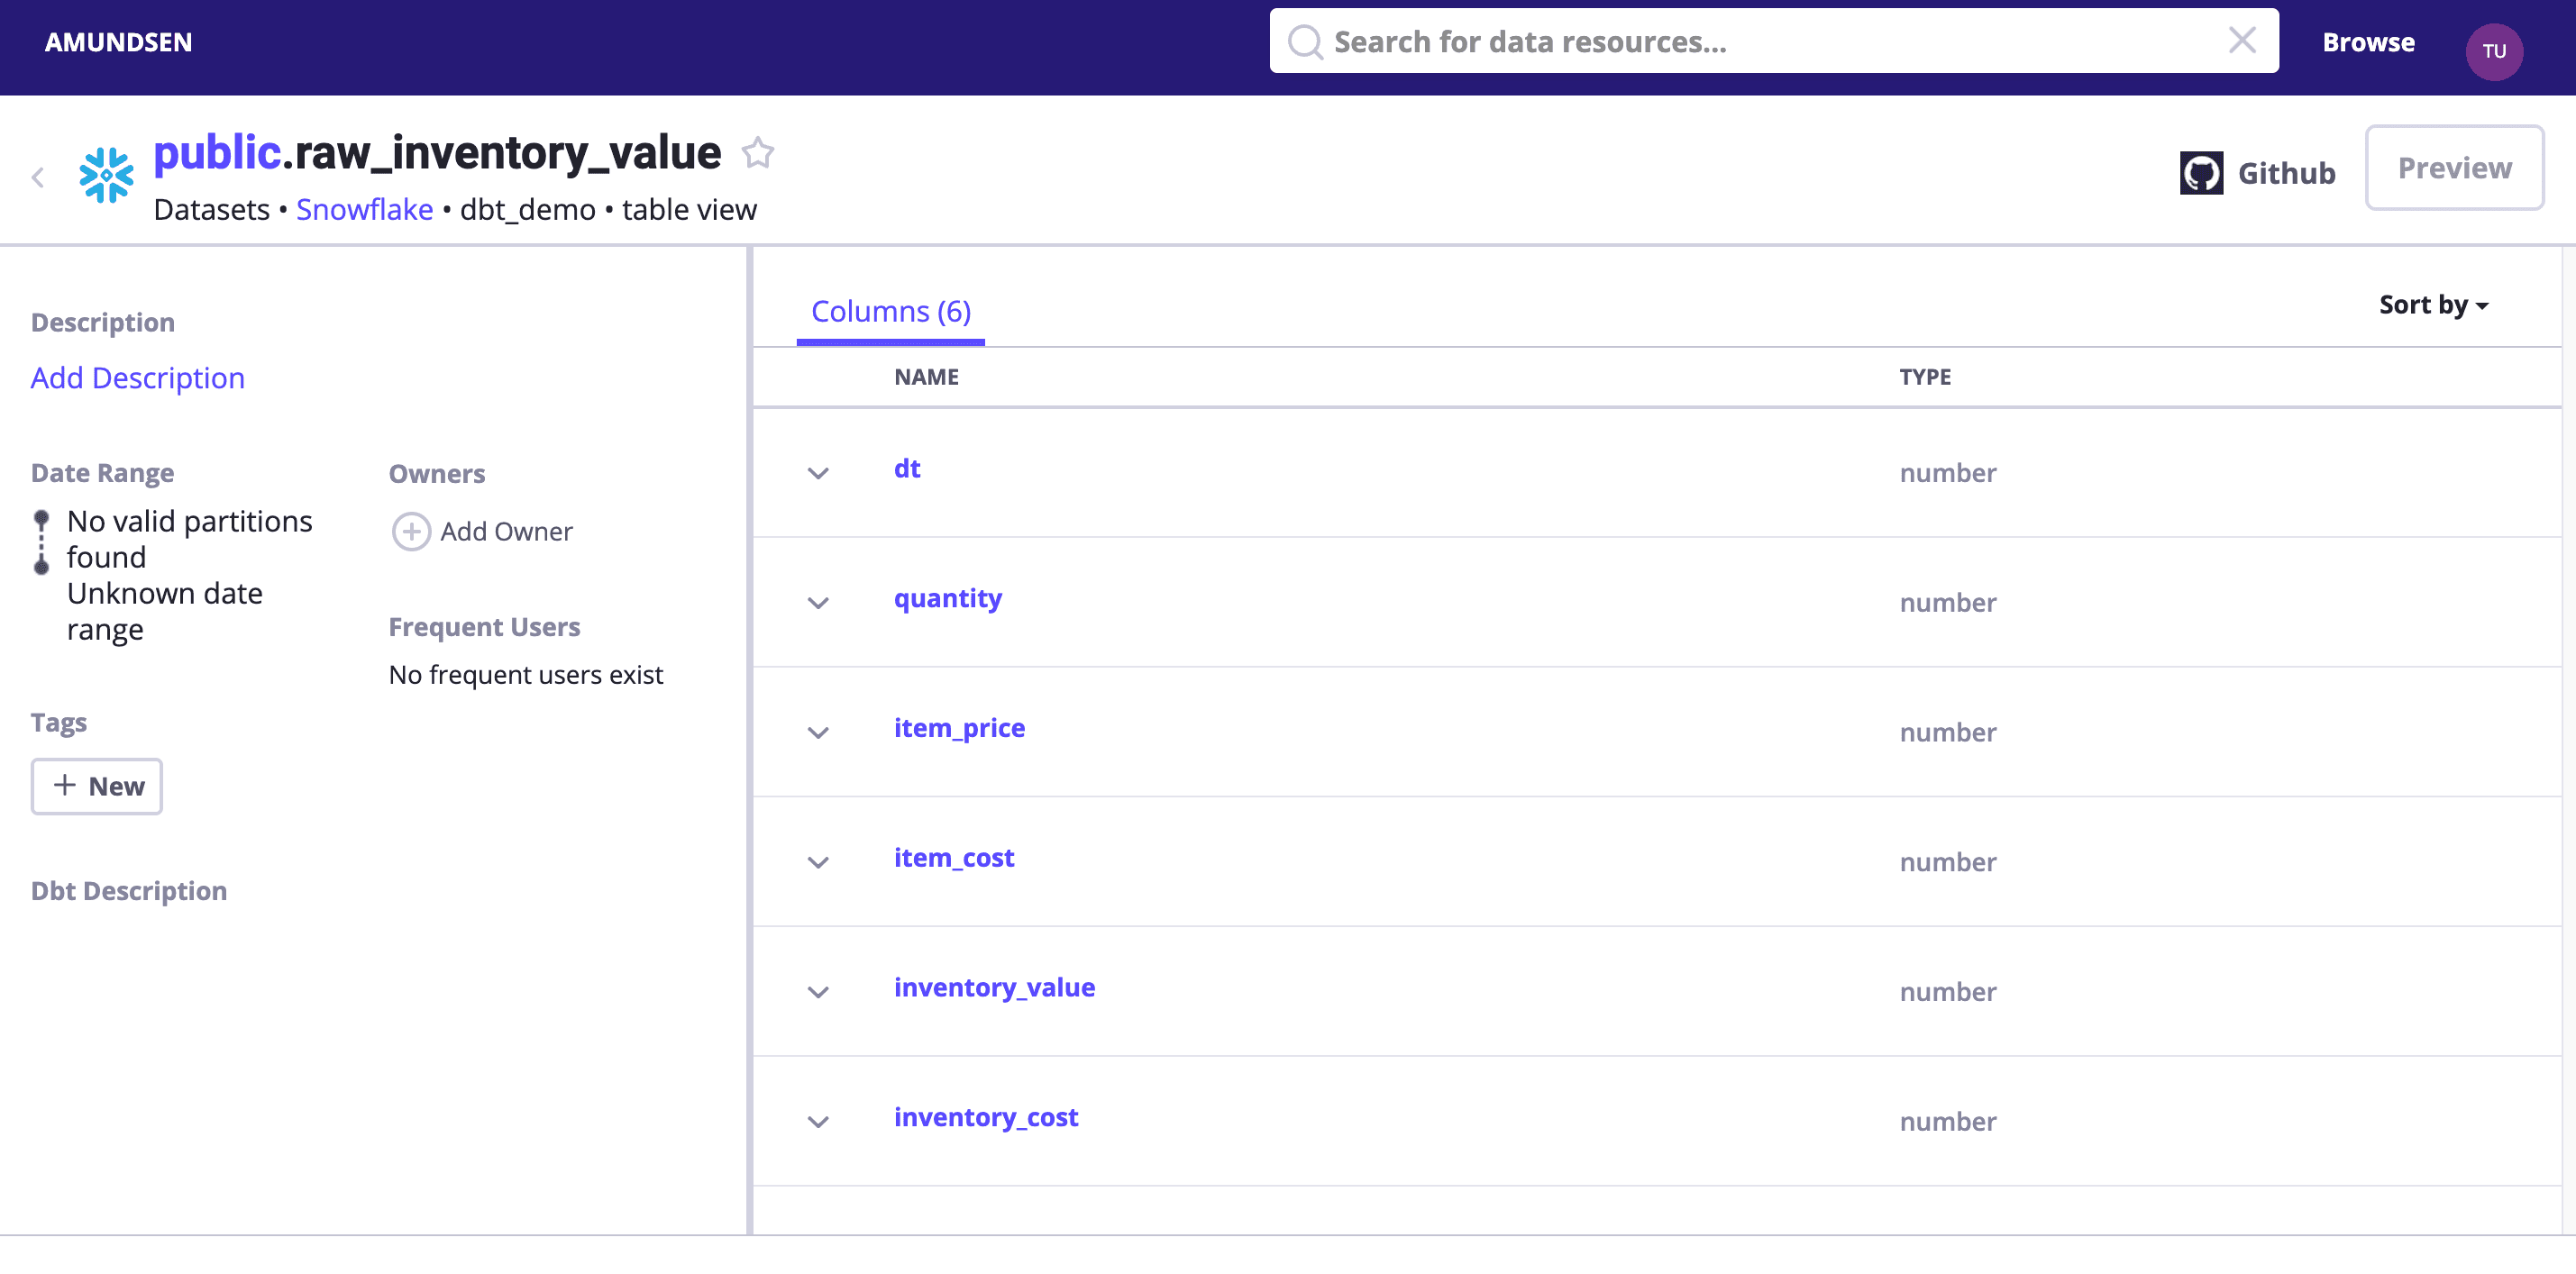
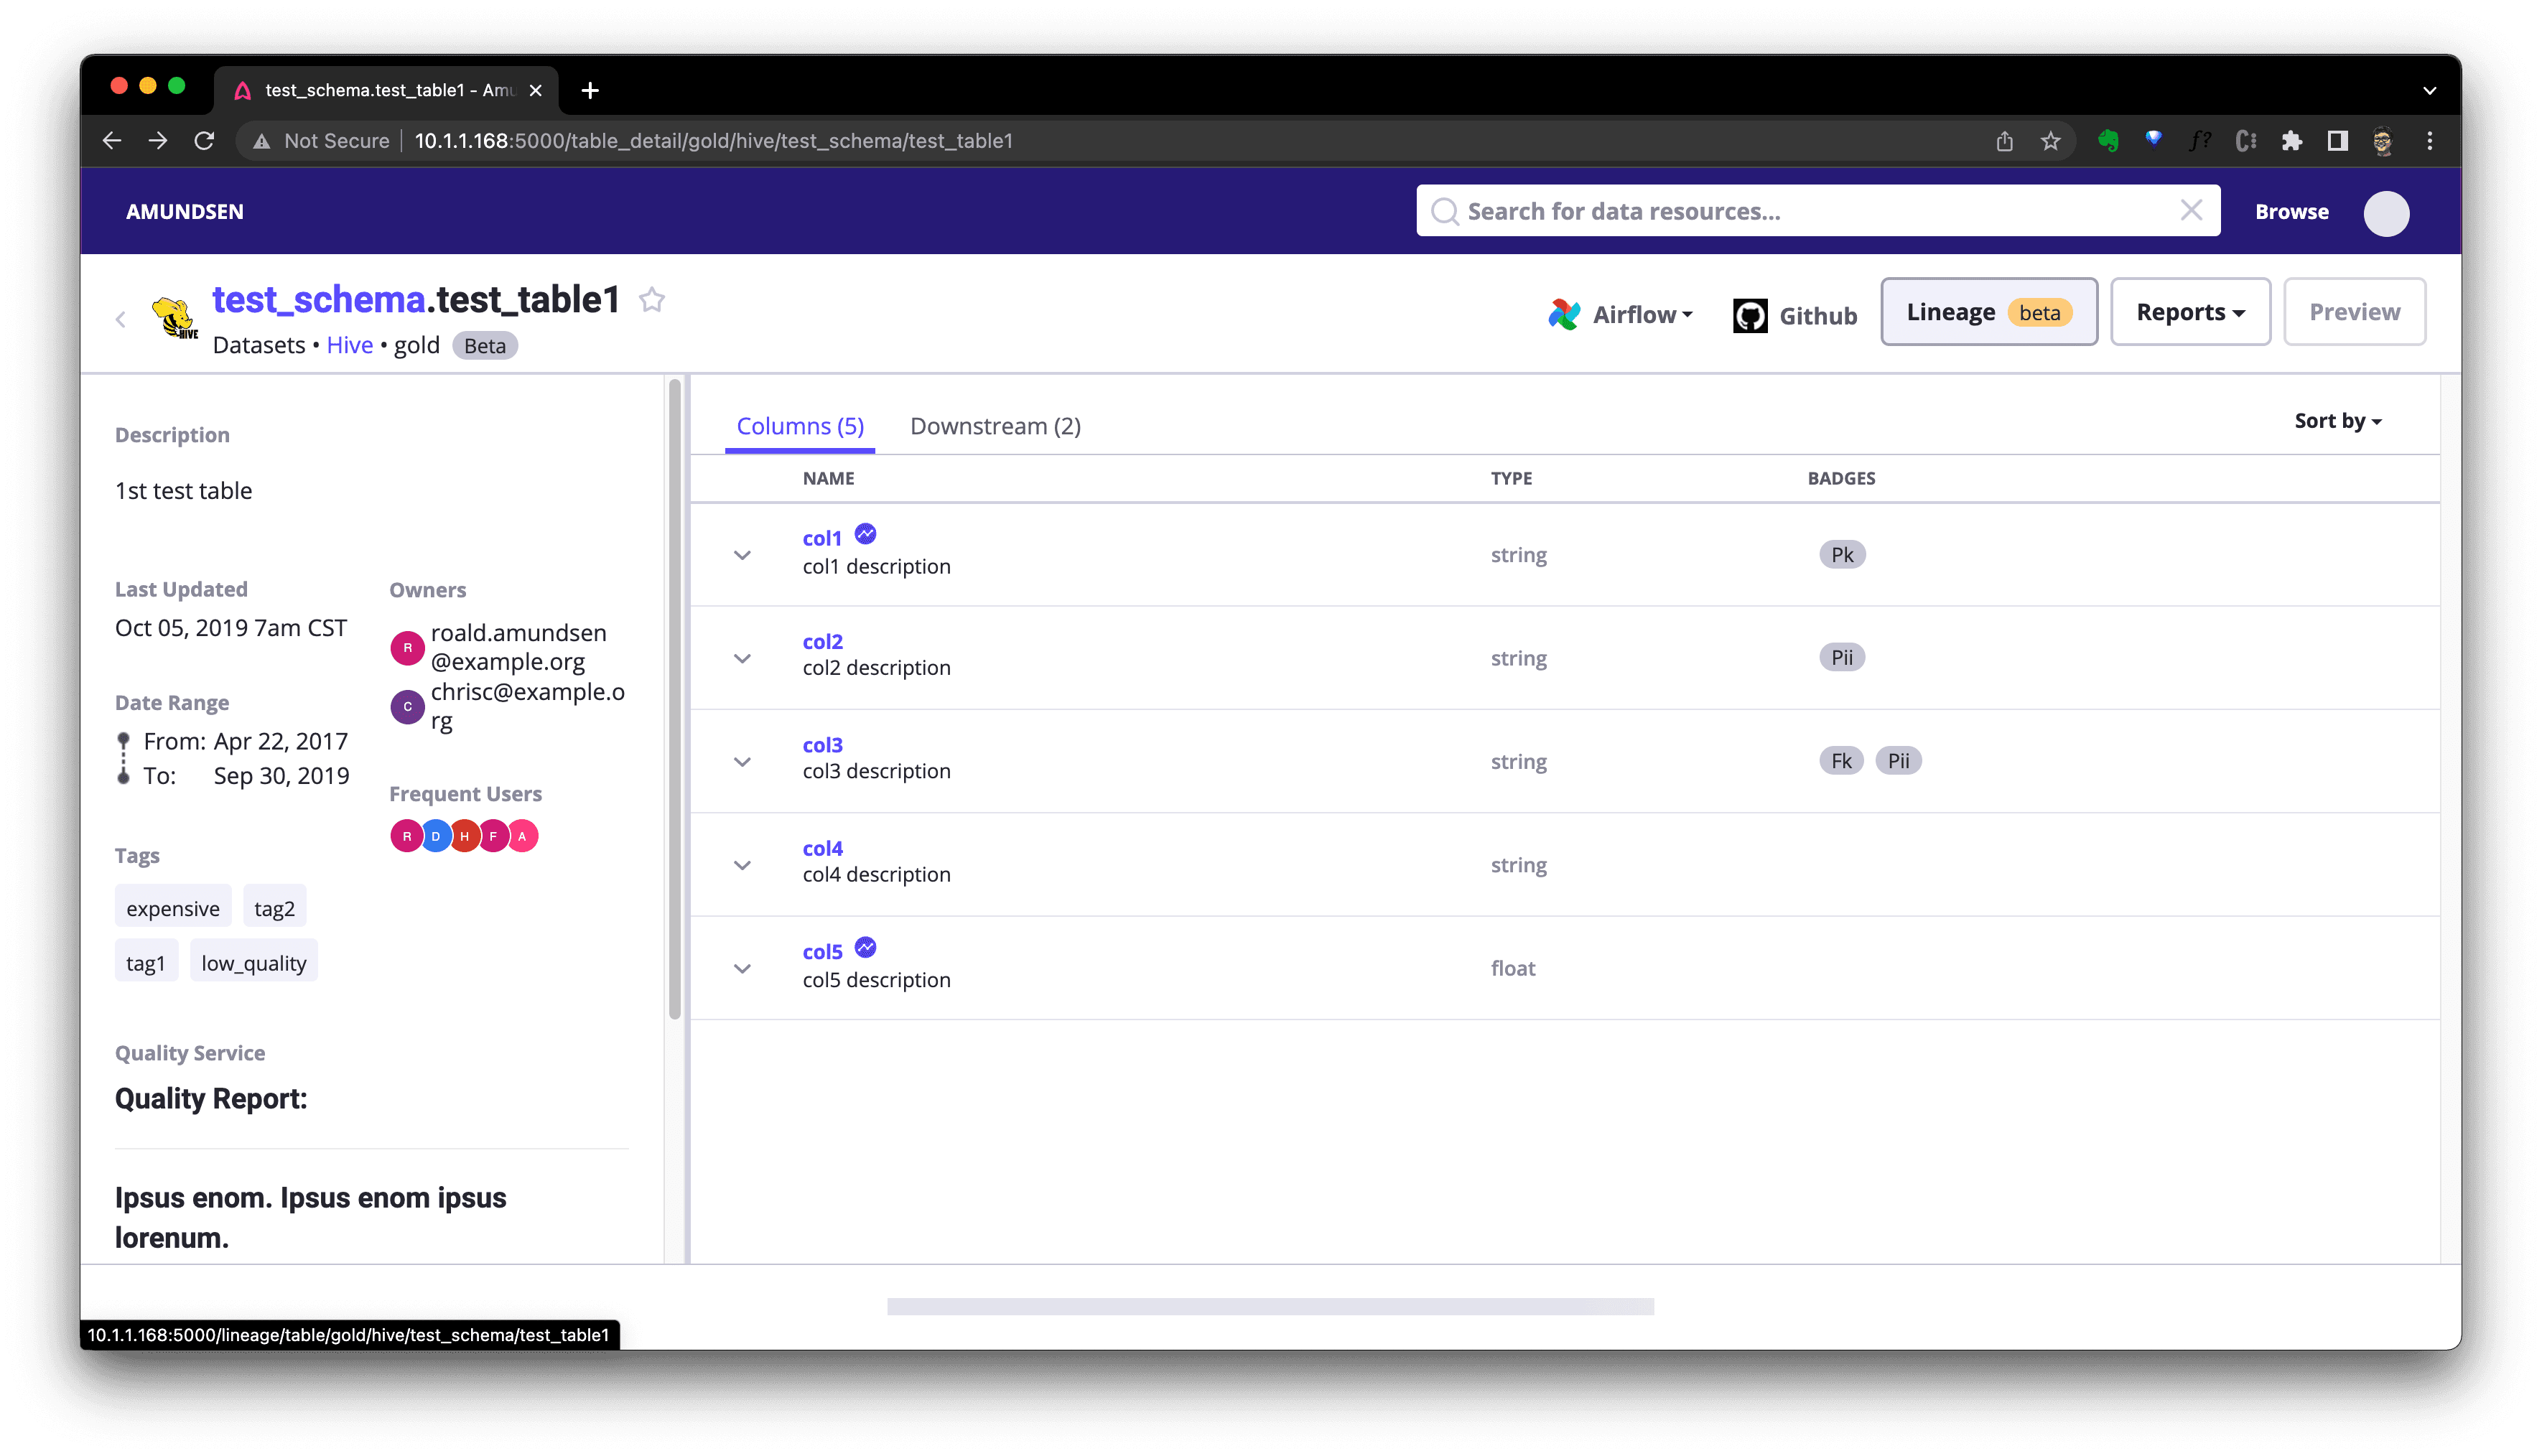
Search dbt_demo or visit http://localhost:5000/table_detail/dbt_demo/snowflake/public/raw_inventory_value to see:
Tips: we could optionally enable debug logging to see what had been sent to Elasticsearch and NebulaGraph!
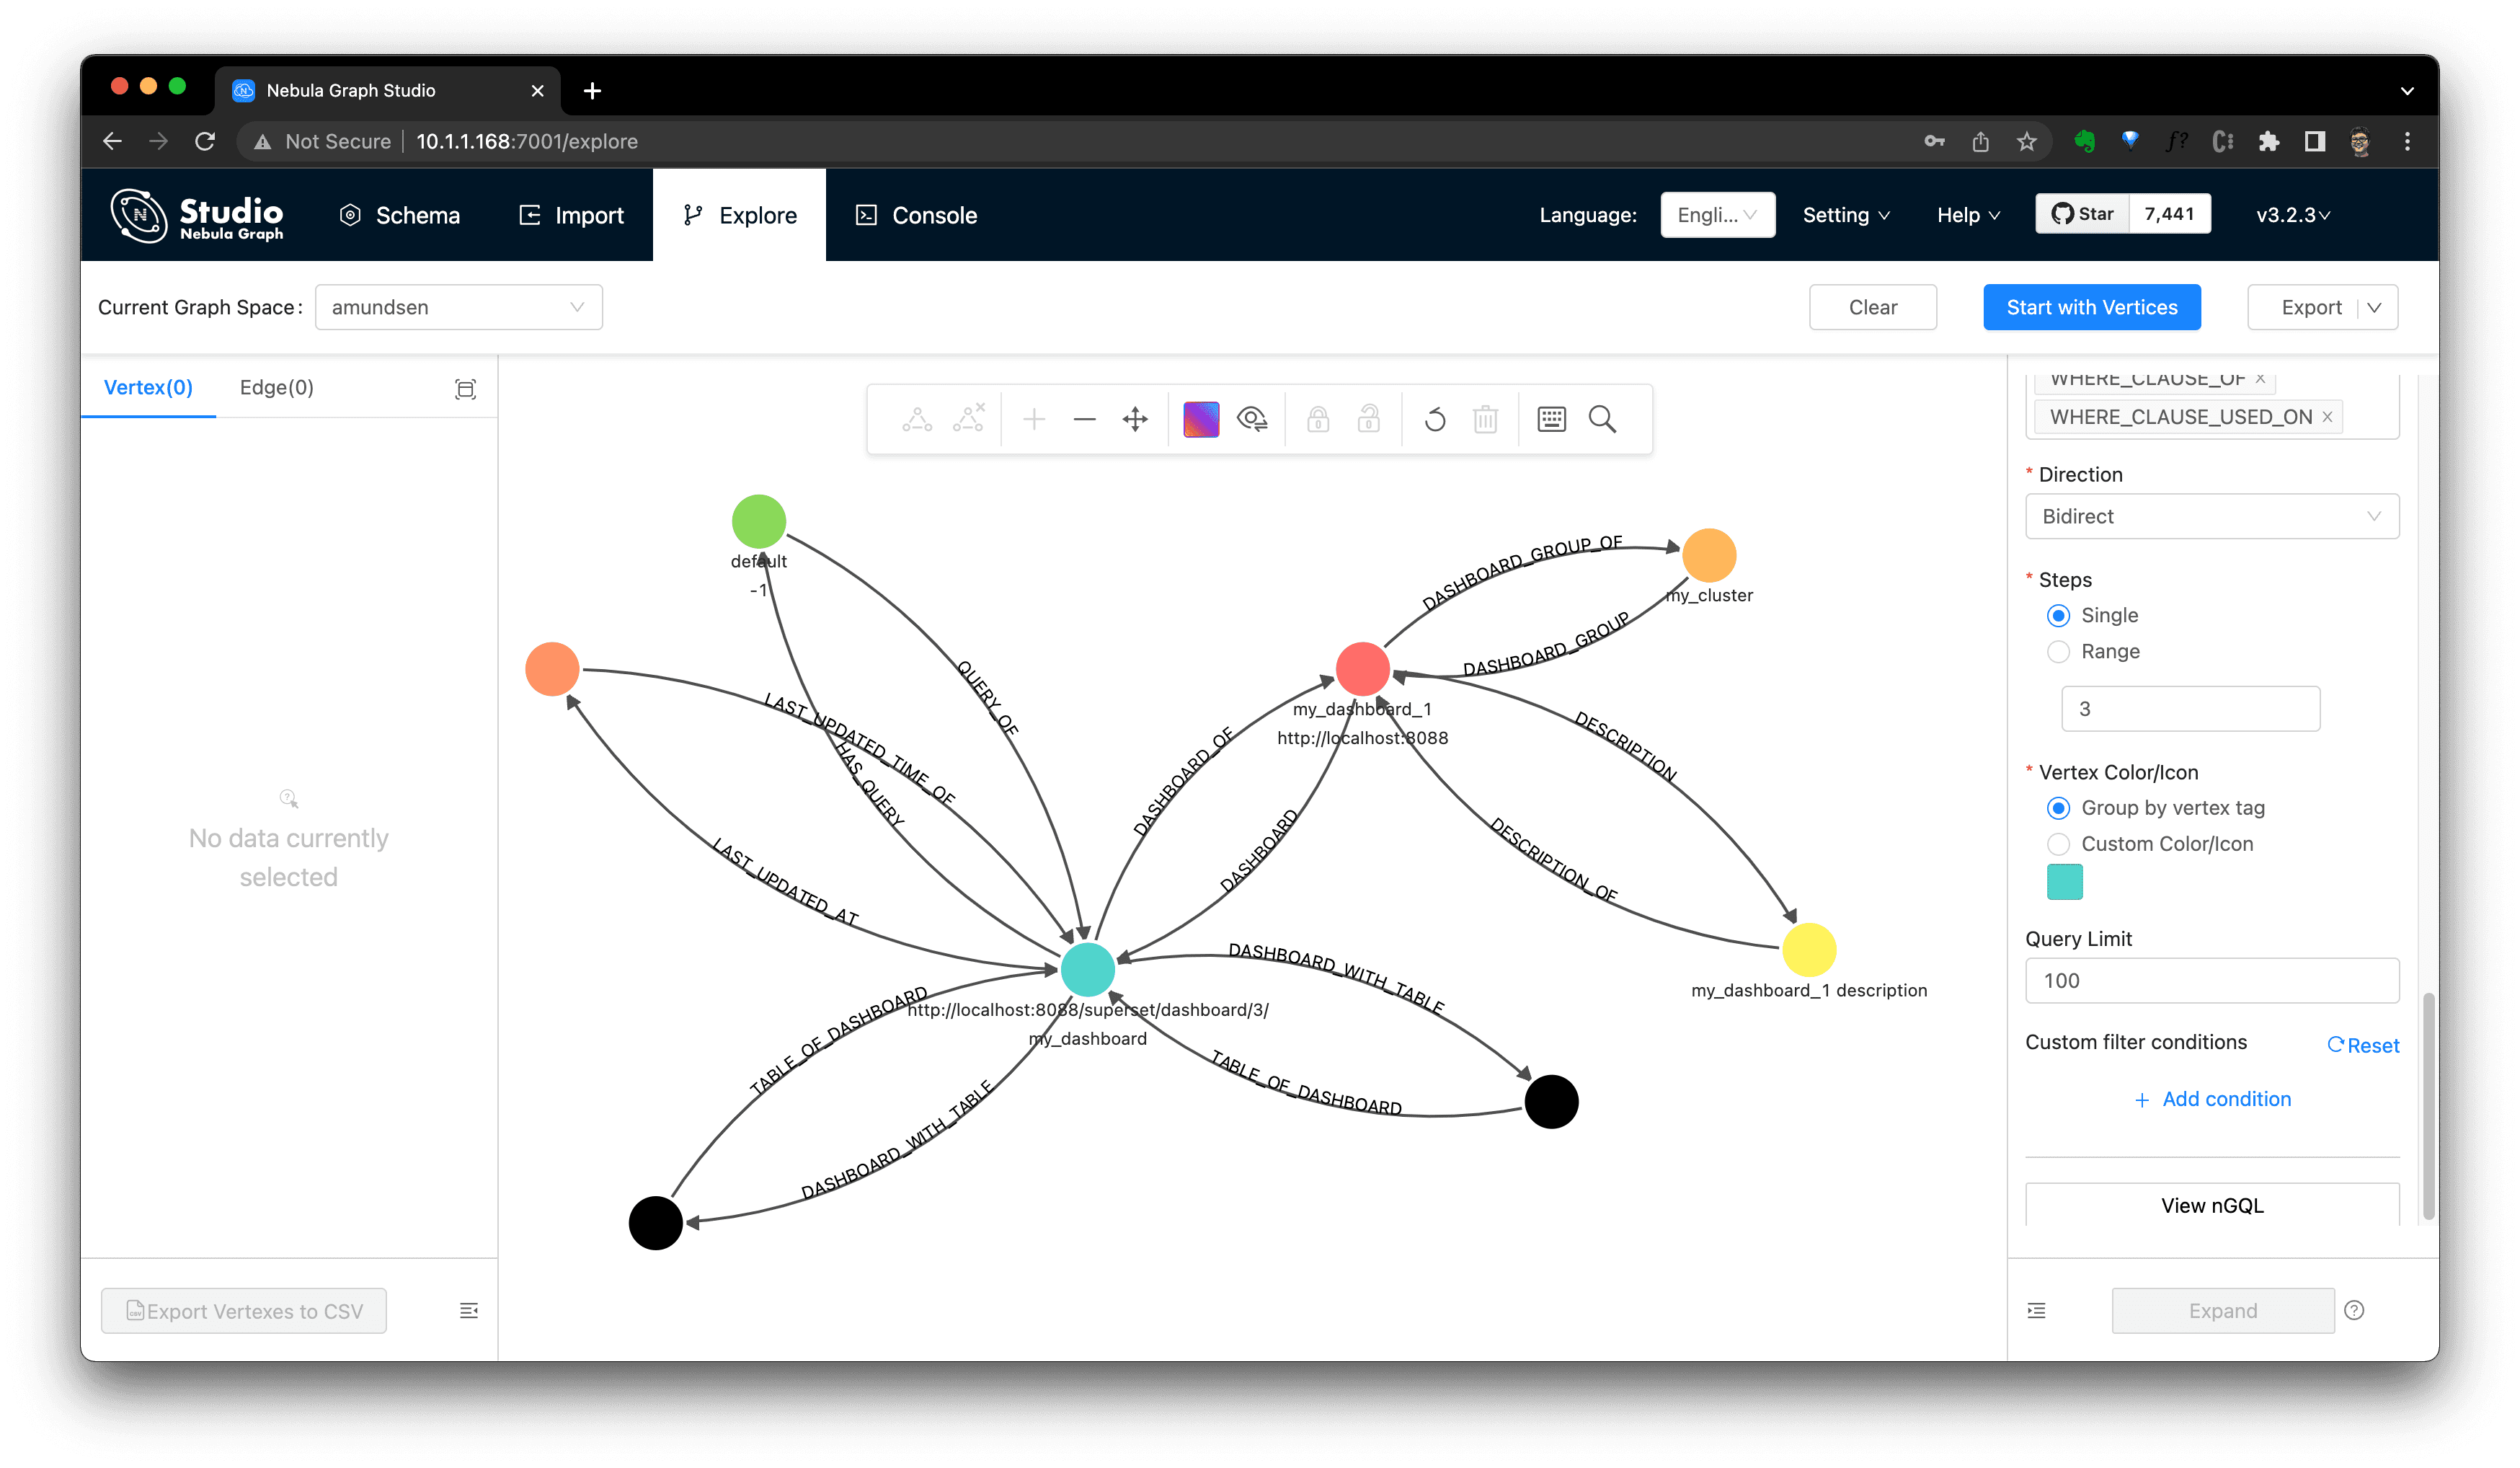
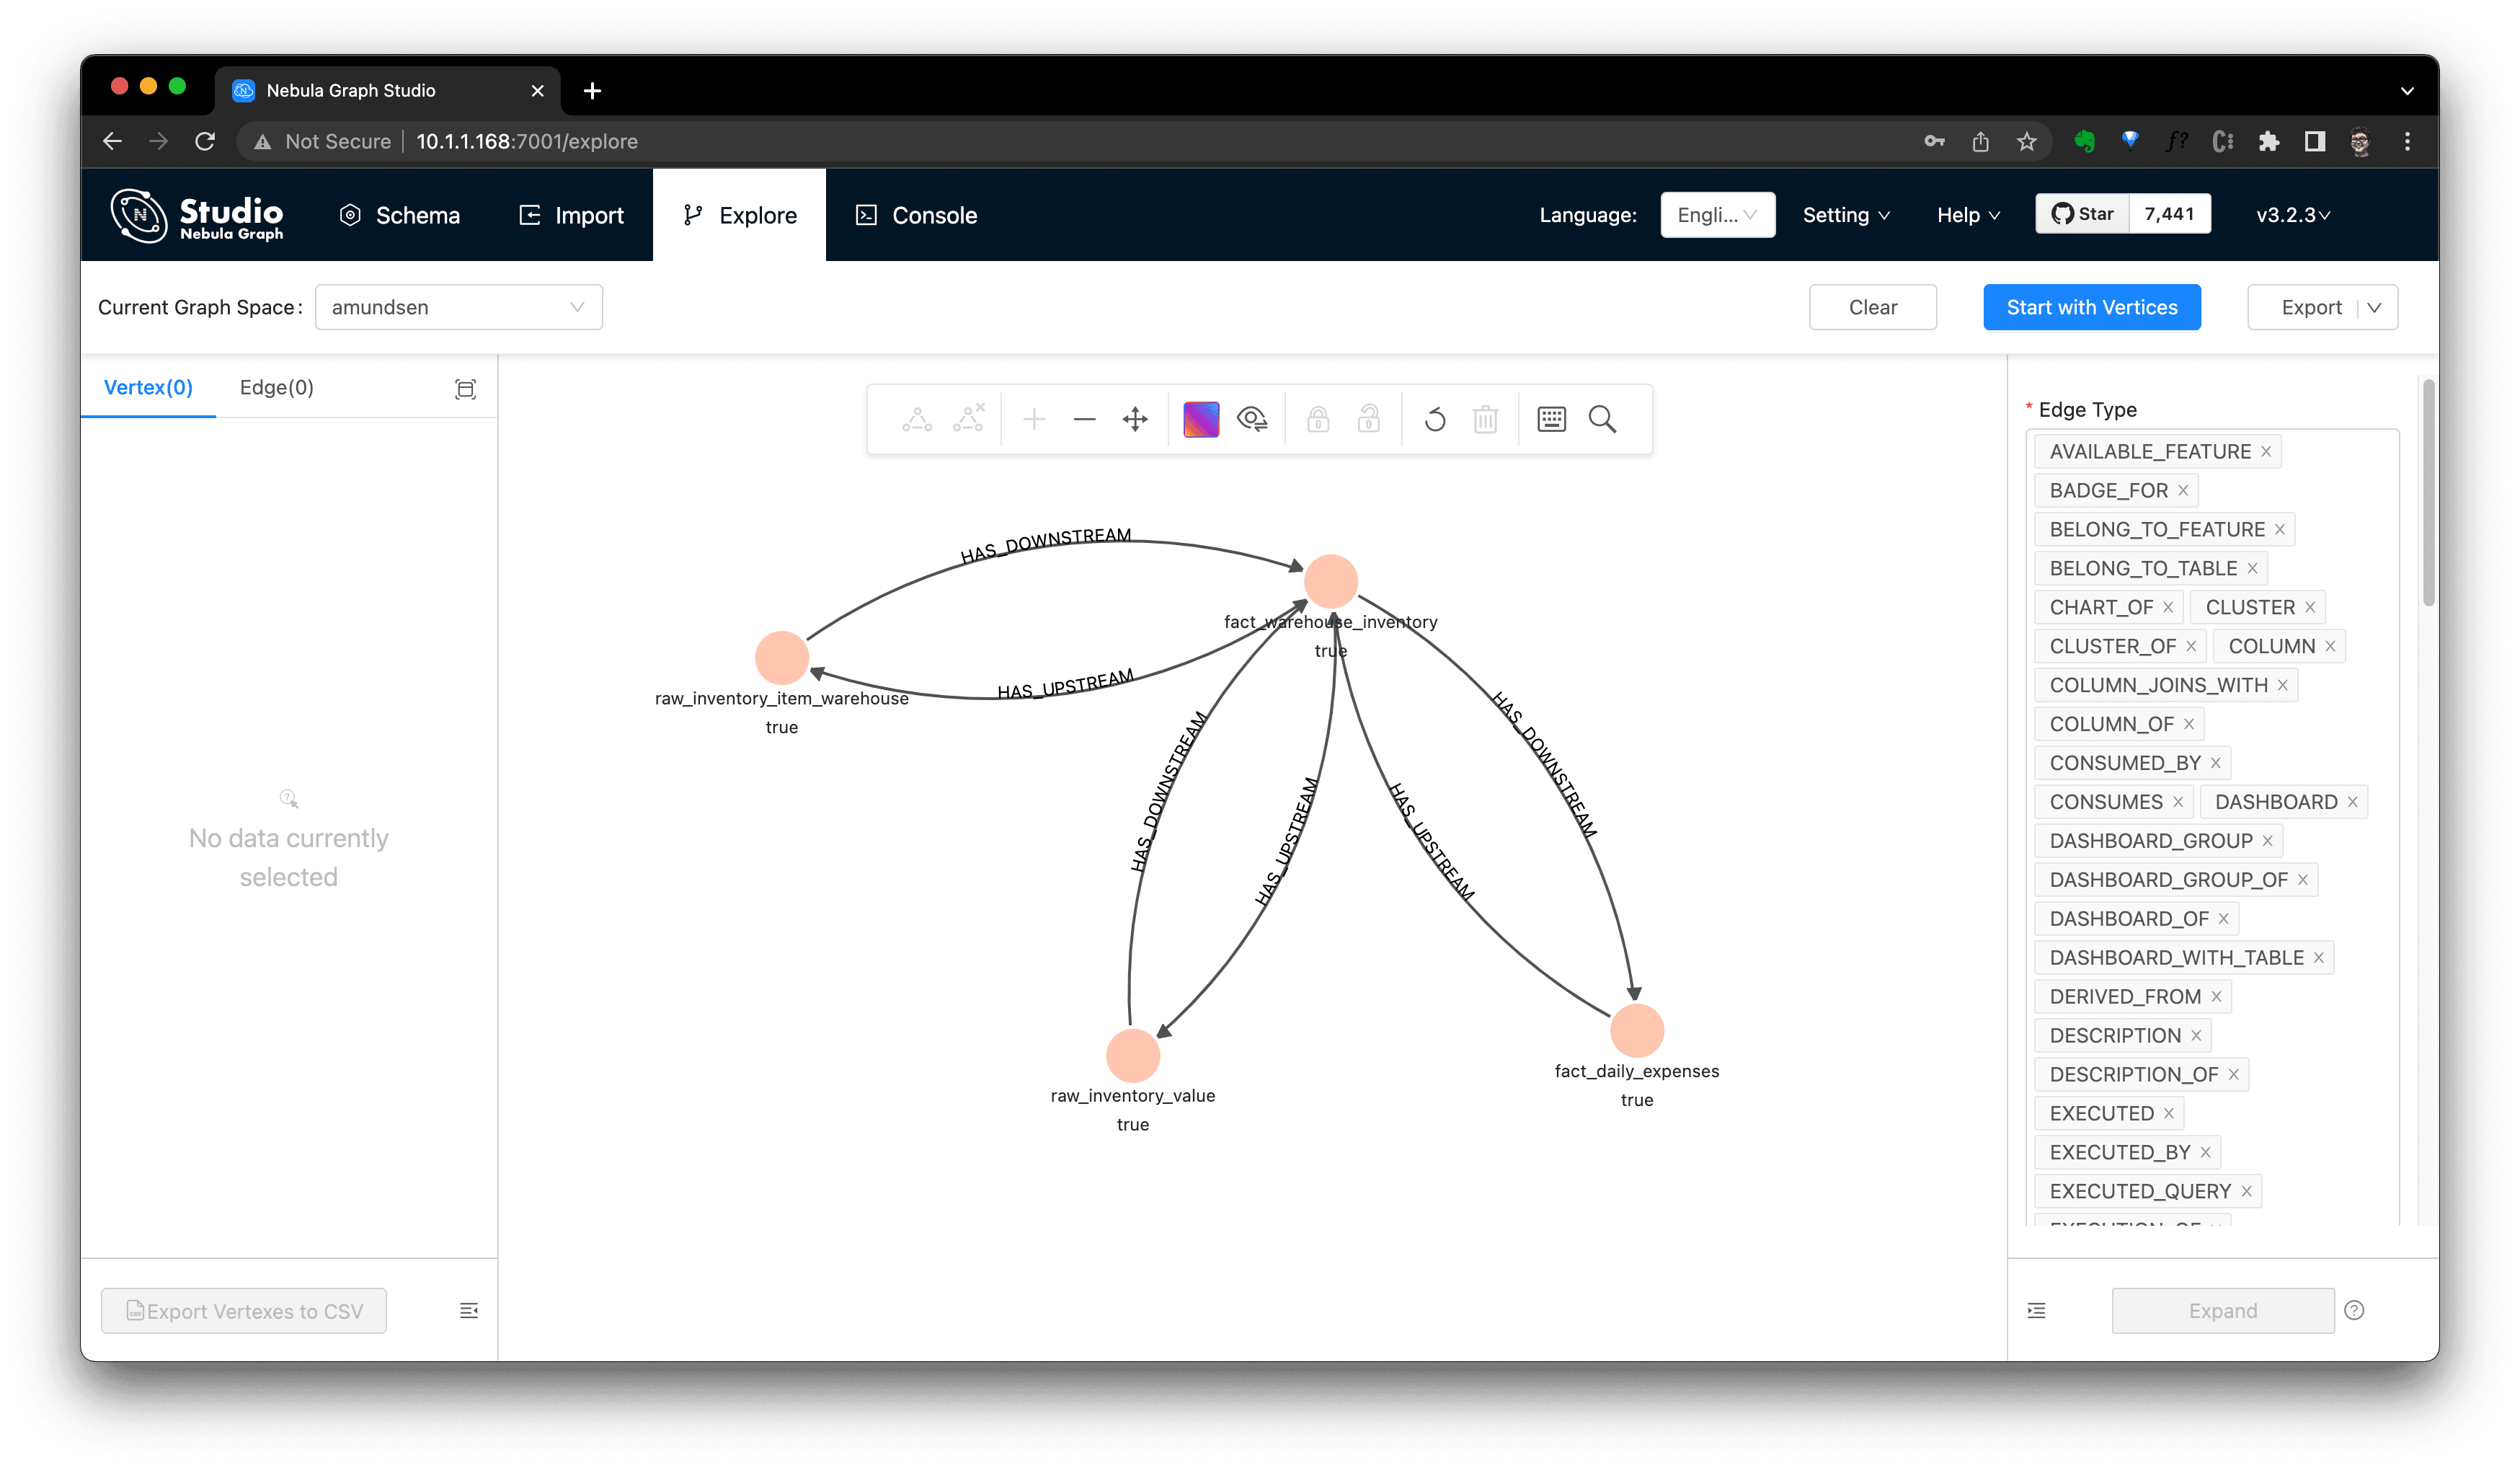
Or, alternatively, explore the imported data in Nebula Studio:
First, click "Start with Vertices", fill in the vertex id: snowflake://dbt_demo.public/fact_warehouse_inventory
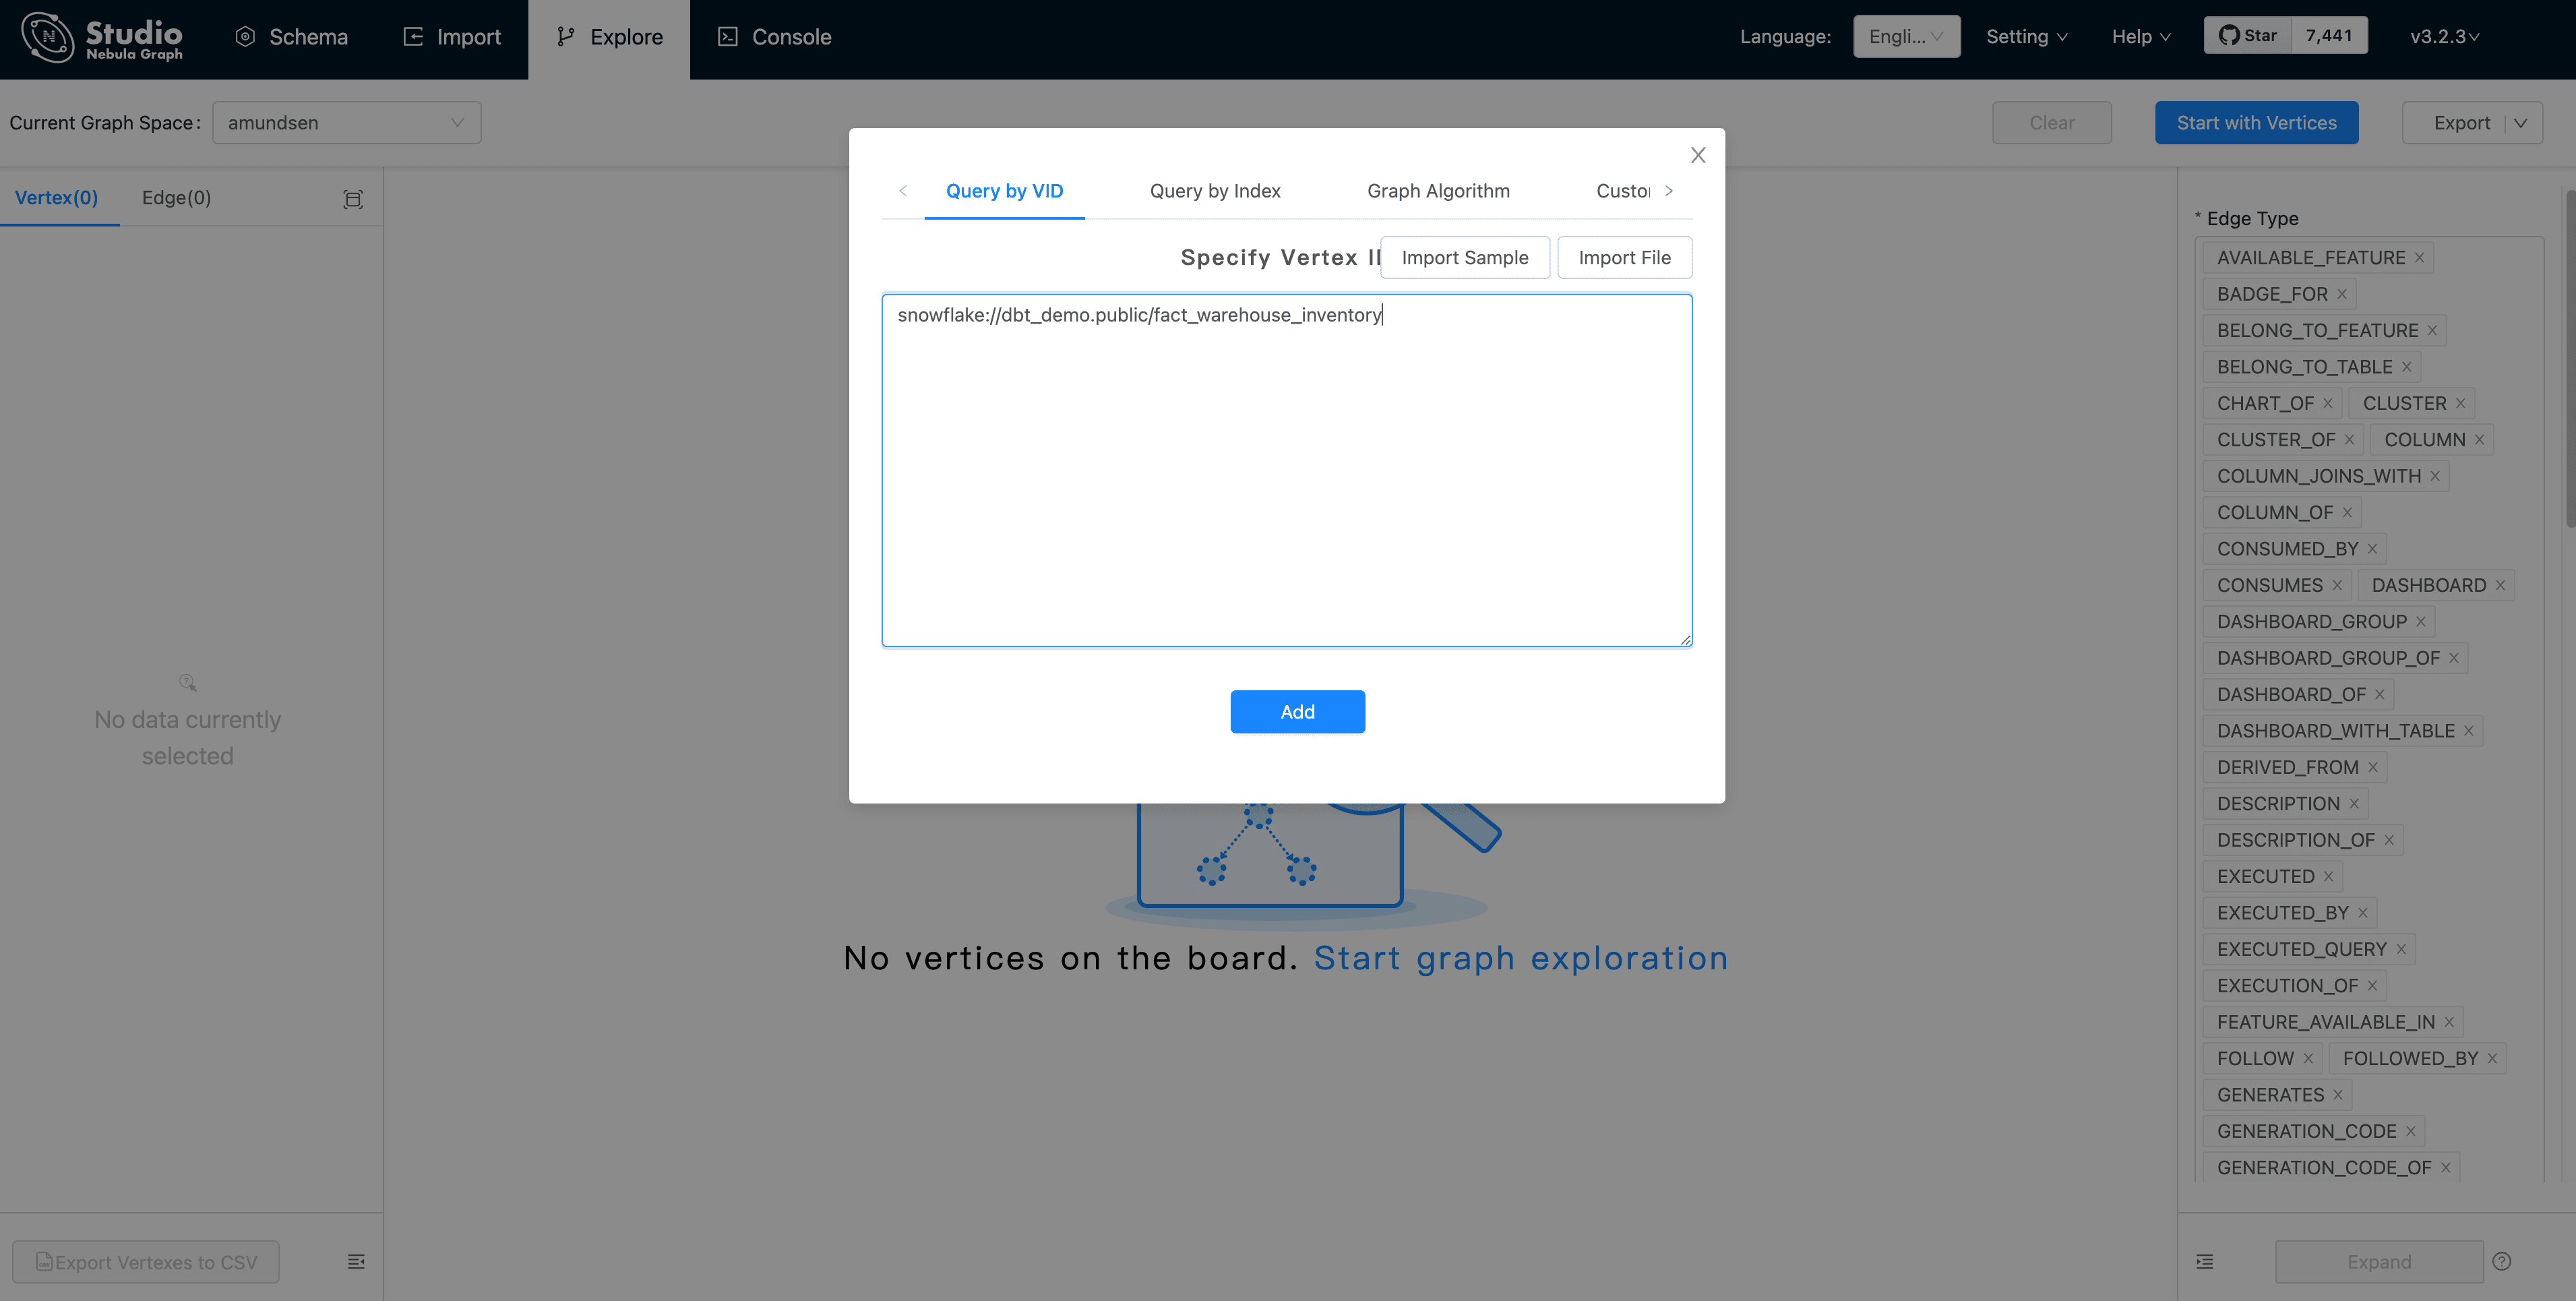
Then, we could see the vertex being shown as the pink dot. Let's modify the Expand options with:
Direction: Bidirect
Steps: Single with 3
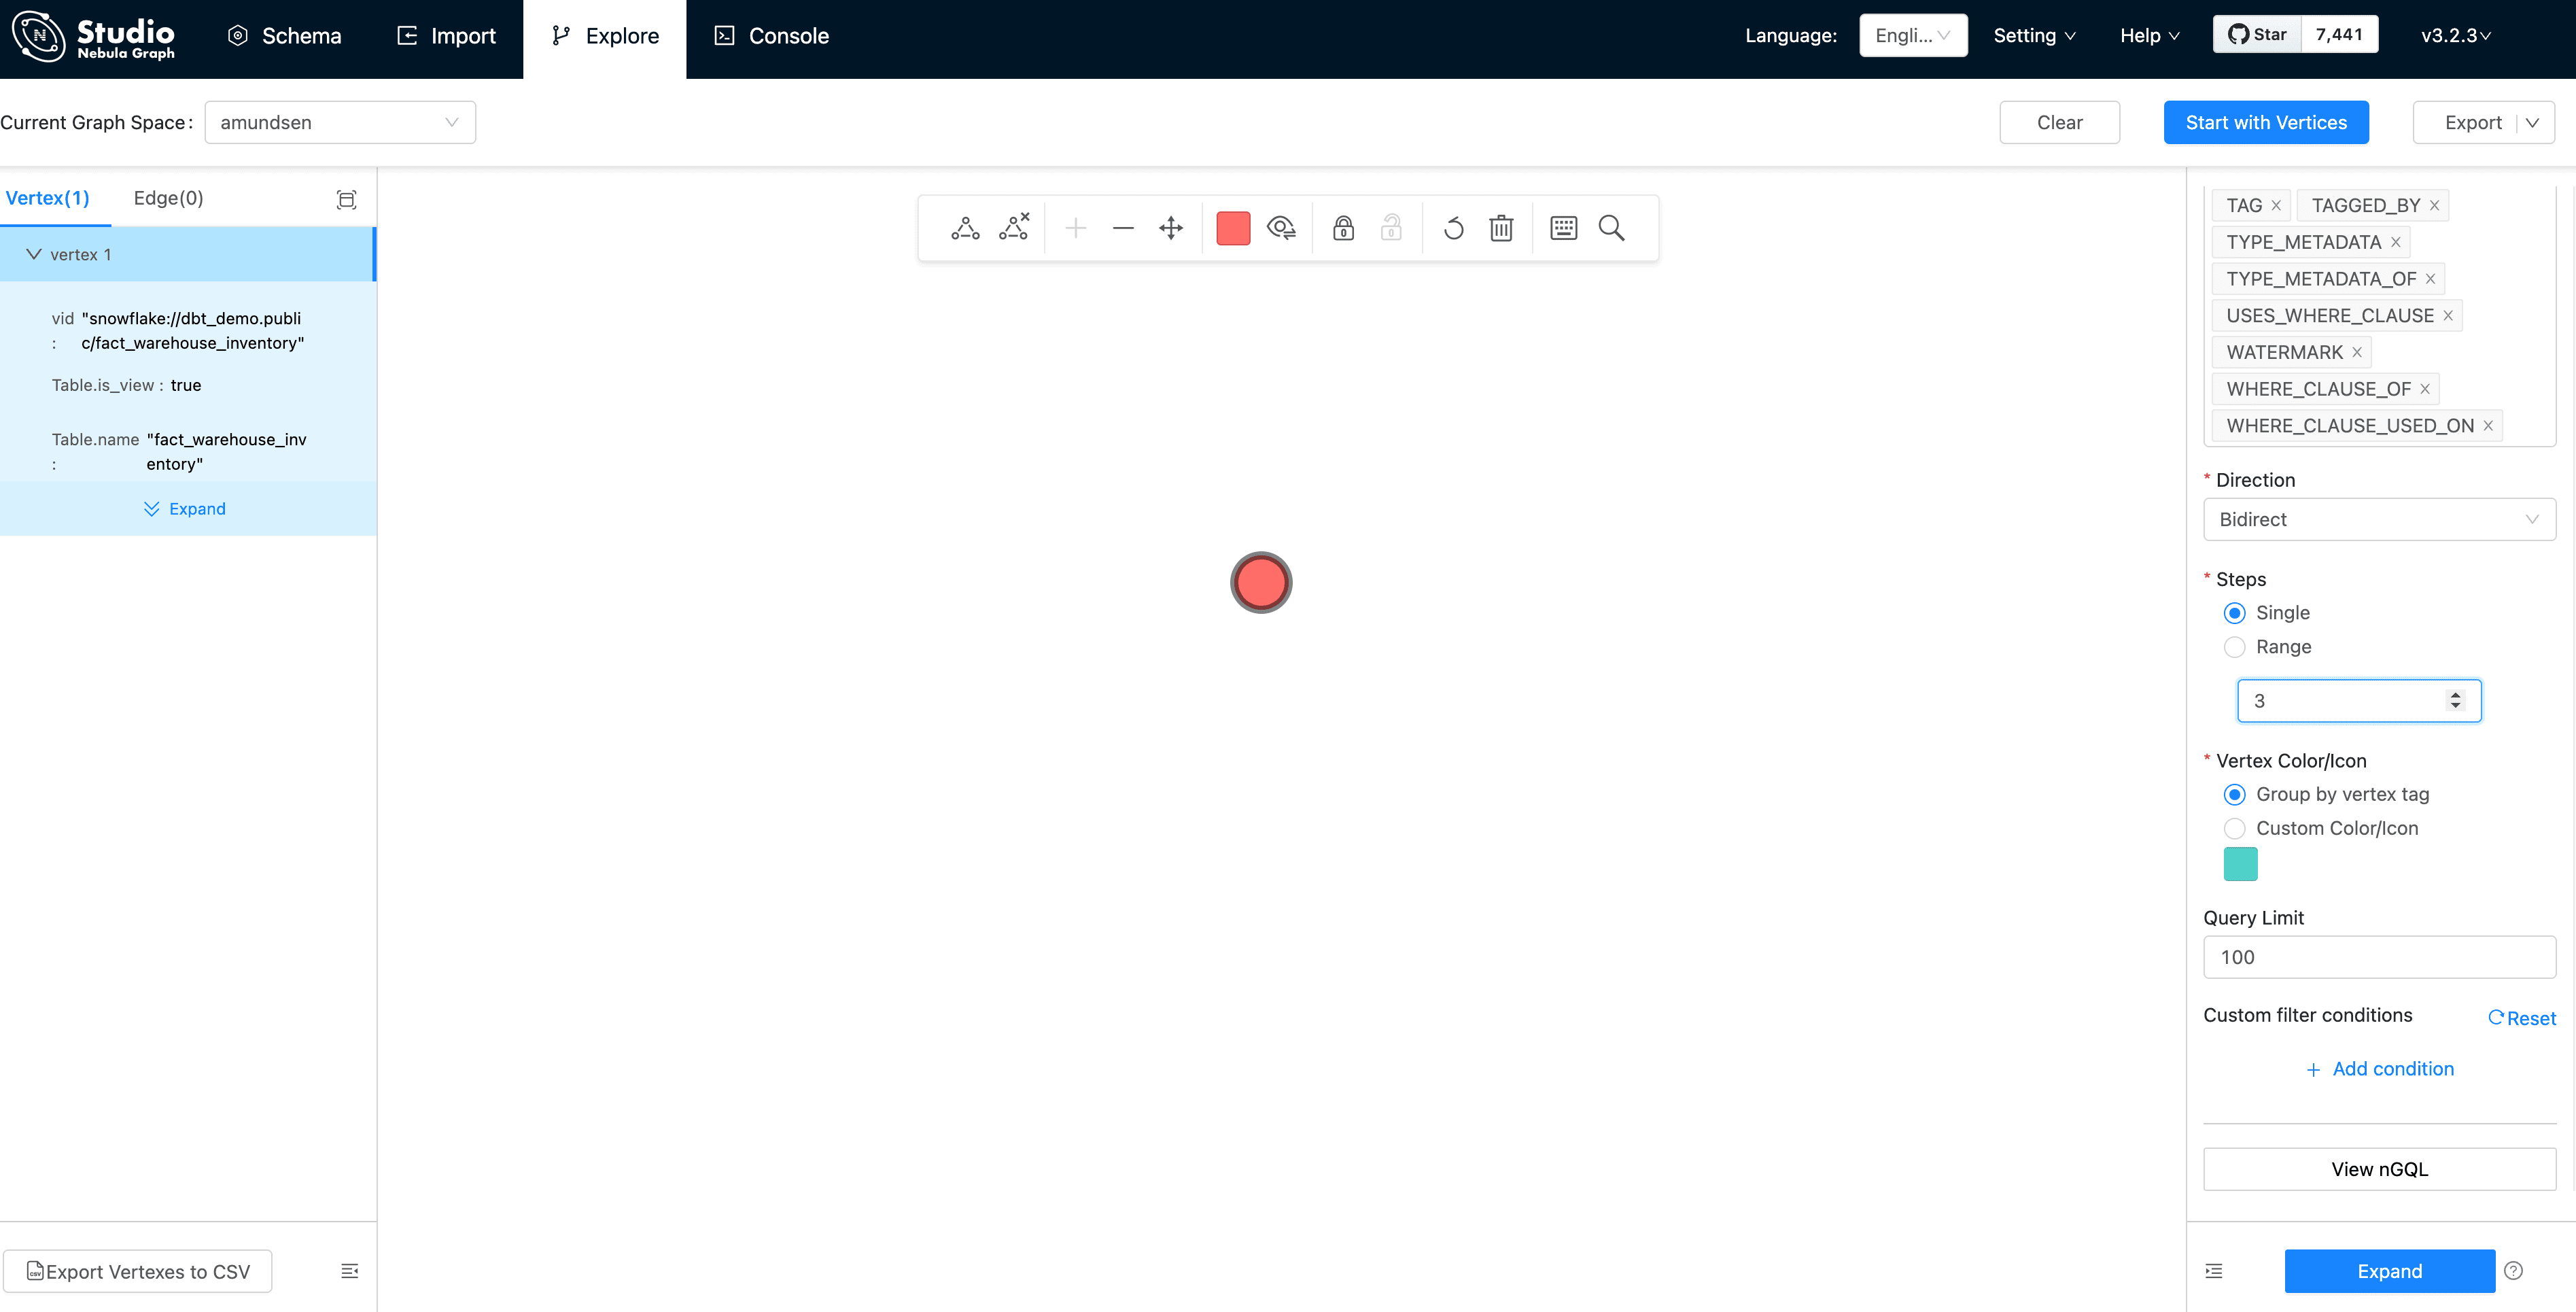
And double click the vertex(dot), it will expand 3 steps in bidirection:
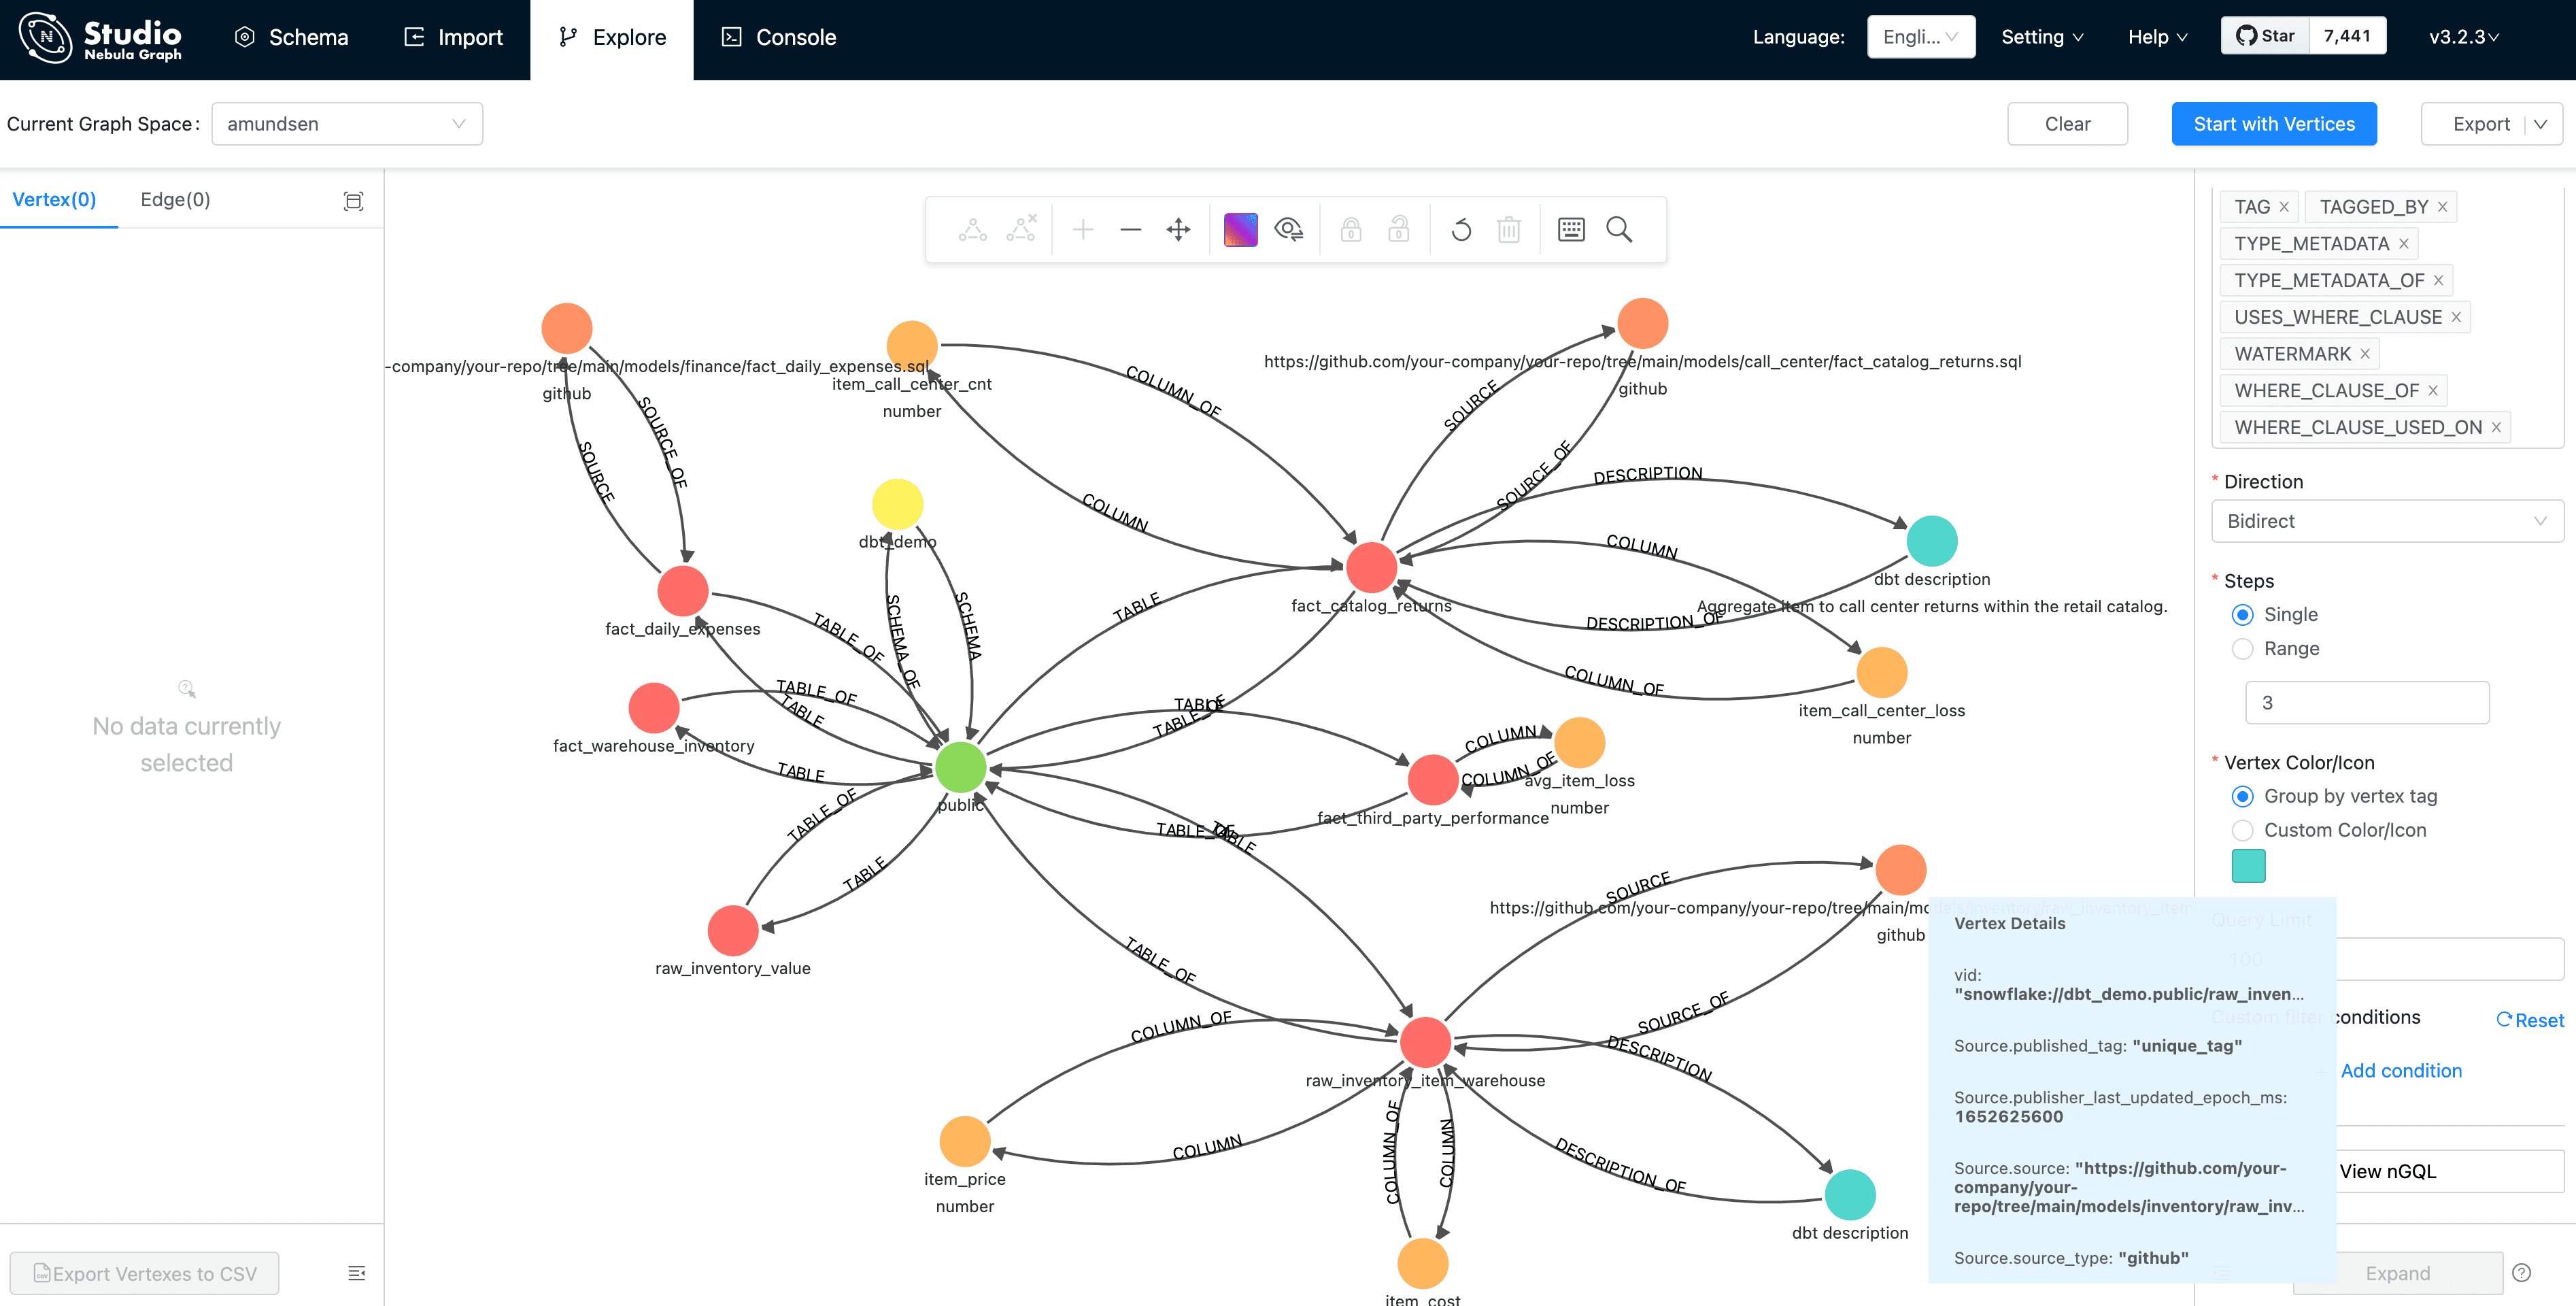
From this graph view, the insight of the metadata is extremely easy to be explored, right?
Tips, you may like to click the 👁 icon to select some properties to be shown, which was done by me before capturing the screen as above.
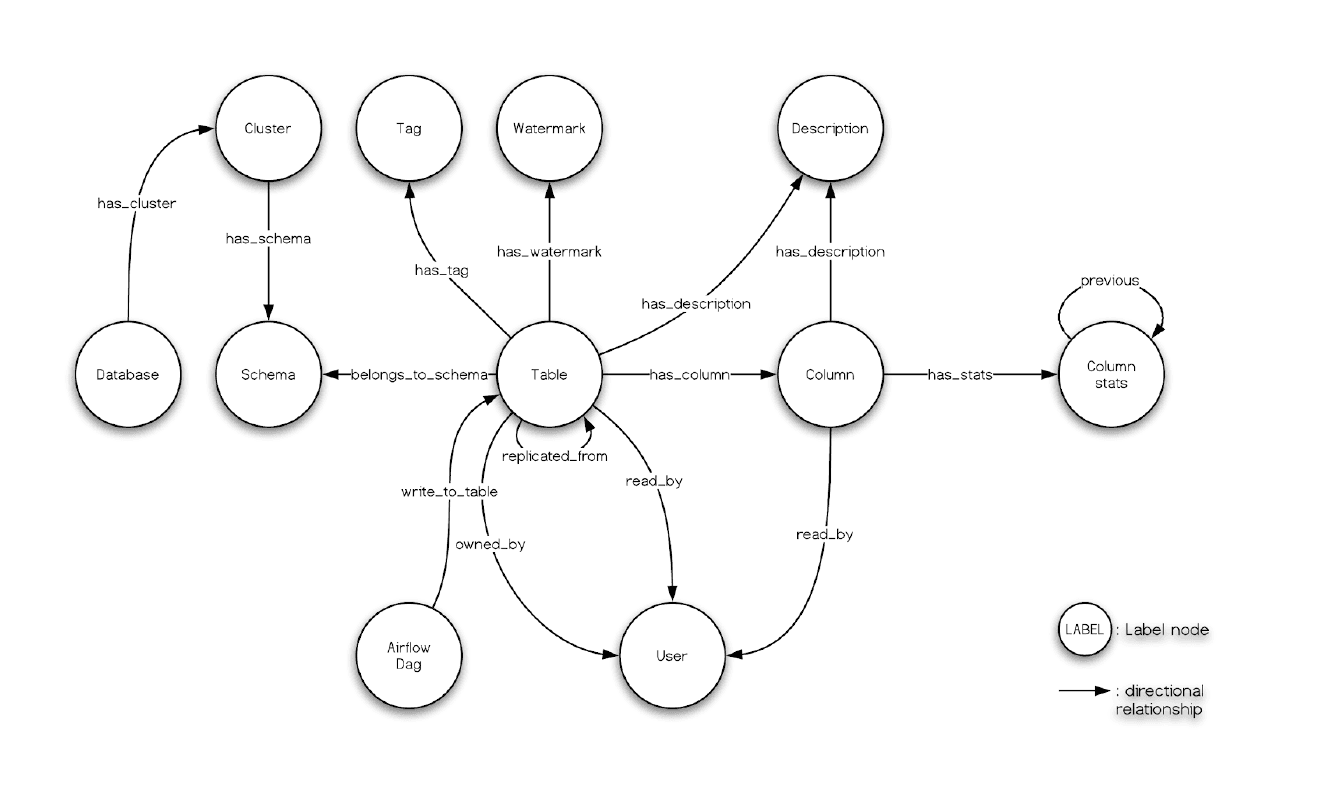
And, what we had seen in the Nebula Studio echoes the data model of Amundsen metadata service, too:
Finally, remember we had leveraged dbt to transform some data in meltano, and the menifest file path is .meltano/transformers/dbt/target/catalog.json, you can try create a databuilder job to import it.
Extracting Superset metadata
Dashboards, Charts and the relationships with Tables can be extracted by Amundsen data builder, as we already setup a Superset Dashboard, let's try ingesting its metadata.
Execution of Superset metadata ETL
The sample superset script will fetch data from Superset and load metadata into NebulaGraph and Elasticsearch.
If we set the logging level to DEBUG, we could actually see lines like:
Verify the Superset Dashboard Extraction
By searching it in Amundsen, we could the Dashboard info now. And we could verify it from Nebula Studio, too.
Note, see also the Dashboard's model in Amundsen from the dashboard ingestion guide:
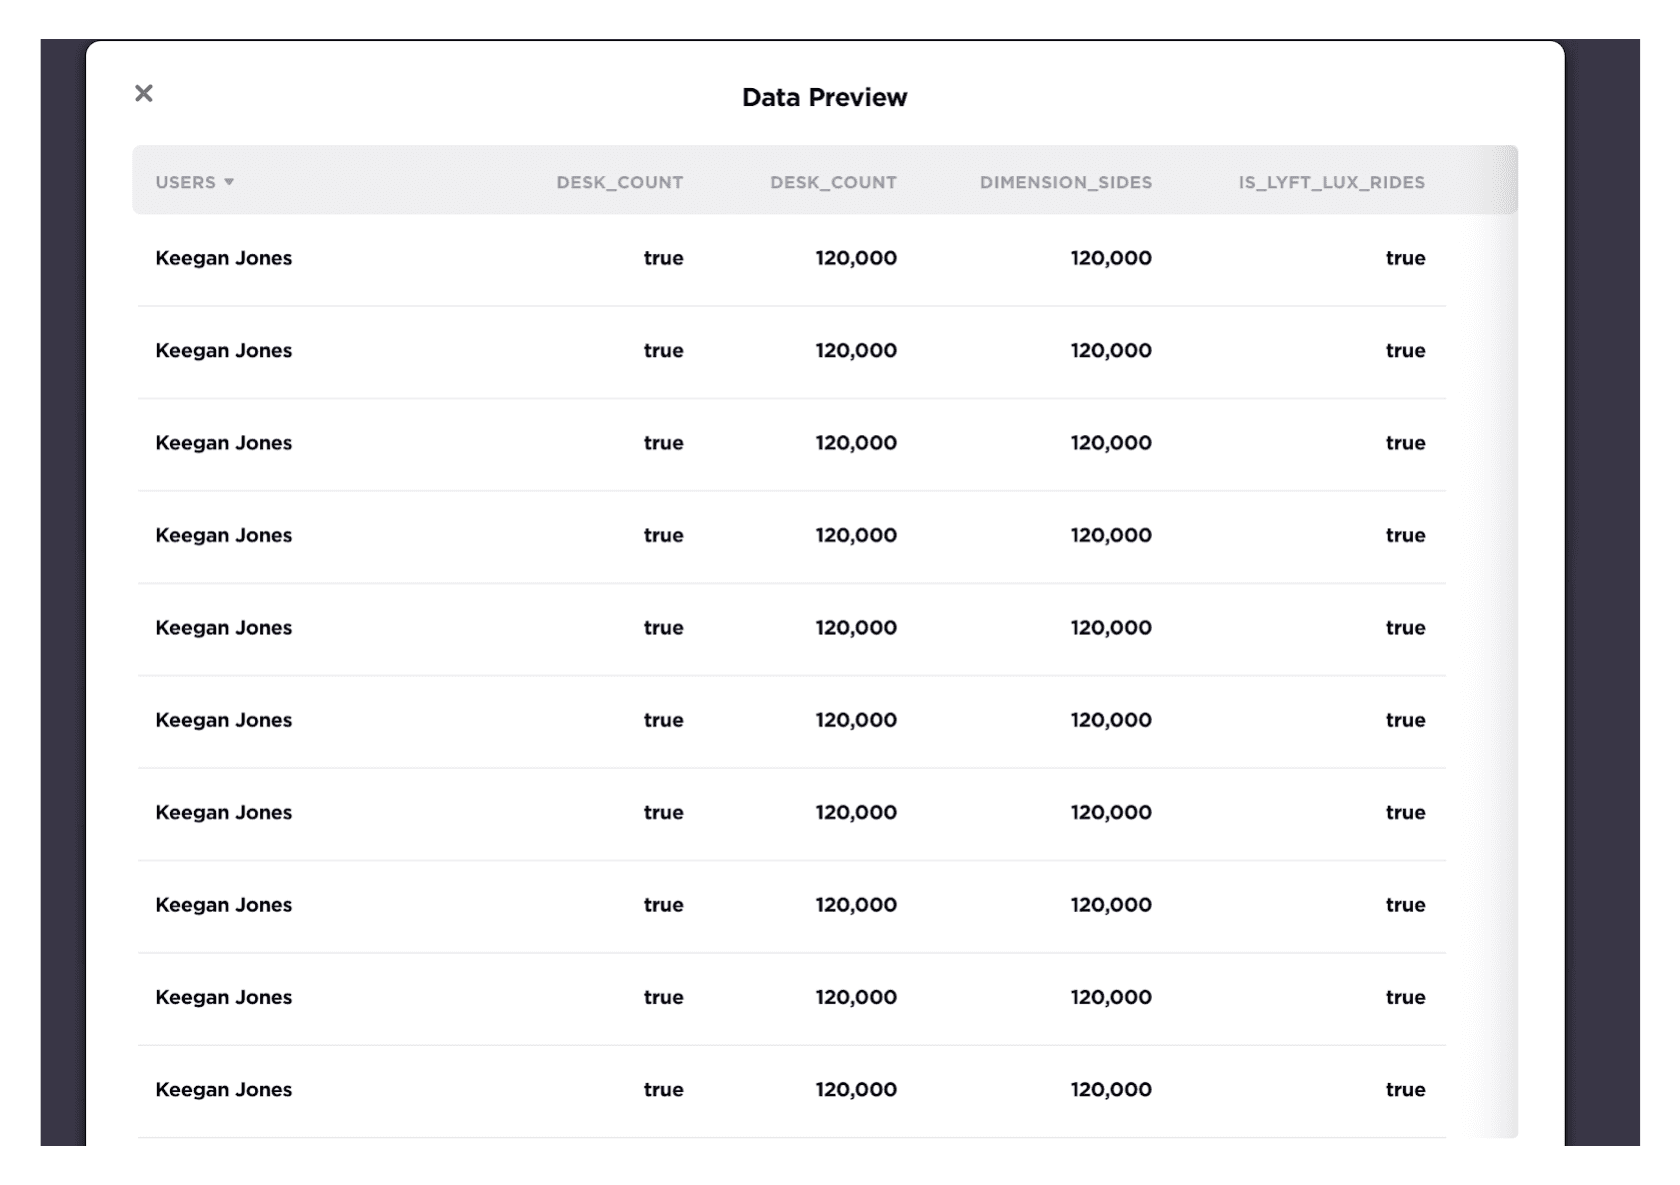
Preview data with Superset
Superset could be used to preview Table Data like this. Corresponding documentation could be referred here, where the API of /superset/sql_json/ will be called by Amundsen Frontend.
Enable Data lineage
By default, data lineage was not enabled, we could enable it by:
Go to the Amundsen repo, that's also where we run the
docker-compose -f docker-amundsen-nebula.yml upcommand
Modify frontend JS configuration:
Now let's run again build for docker image, where the frontend image will be rebuilt.
Then, rerun the up -d to ensure frontend container to be recreated with new configuration:
We could see something like this:
After that, we could visit http://localhost:5000/lineage/table/gold/hive/test_schema/test_table1 to see the Lineage is shown as:
We could click Downstream(if there is) to see downstream resources of this table:
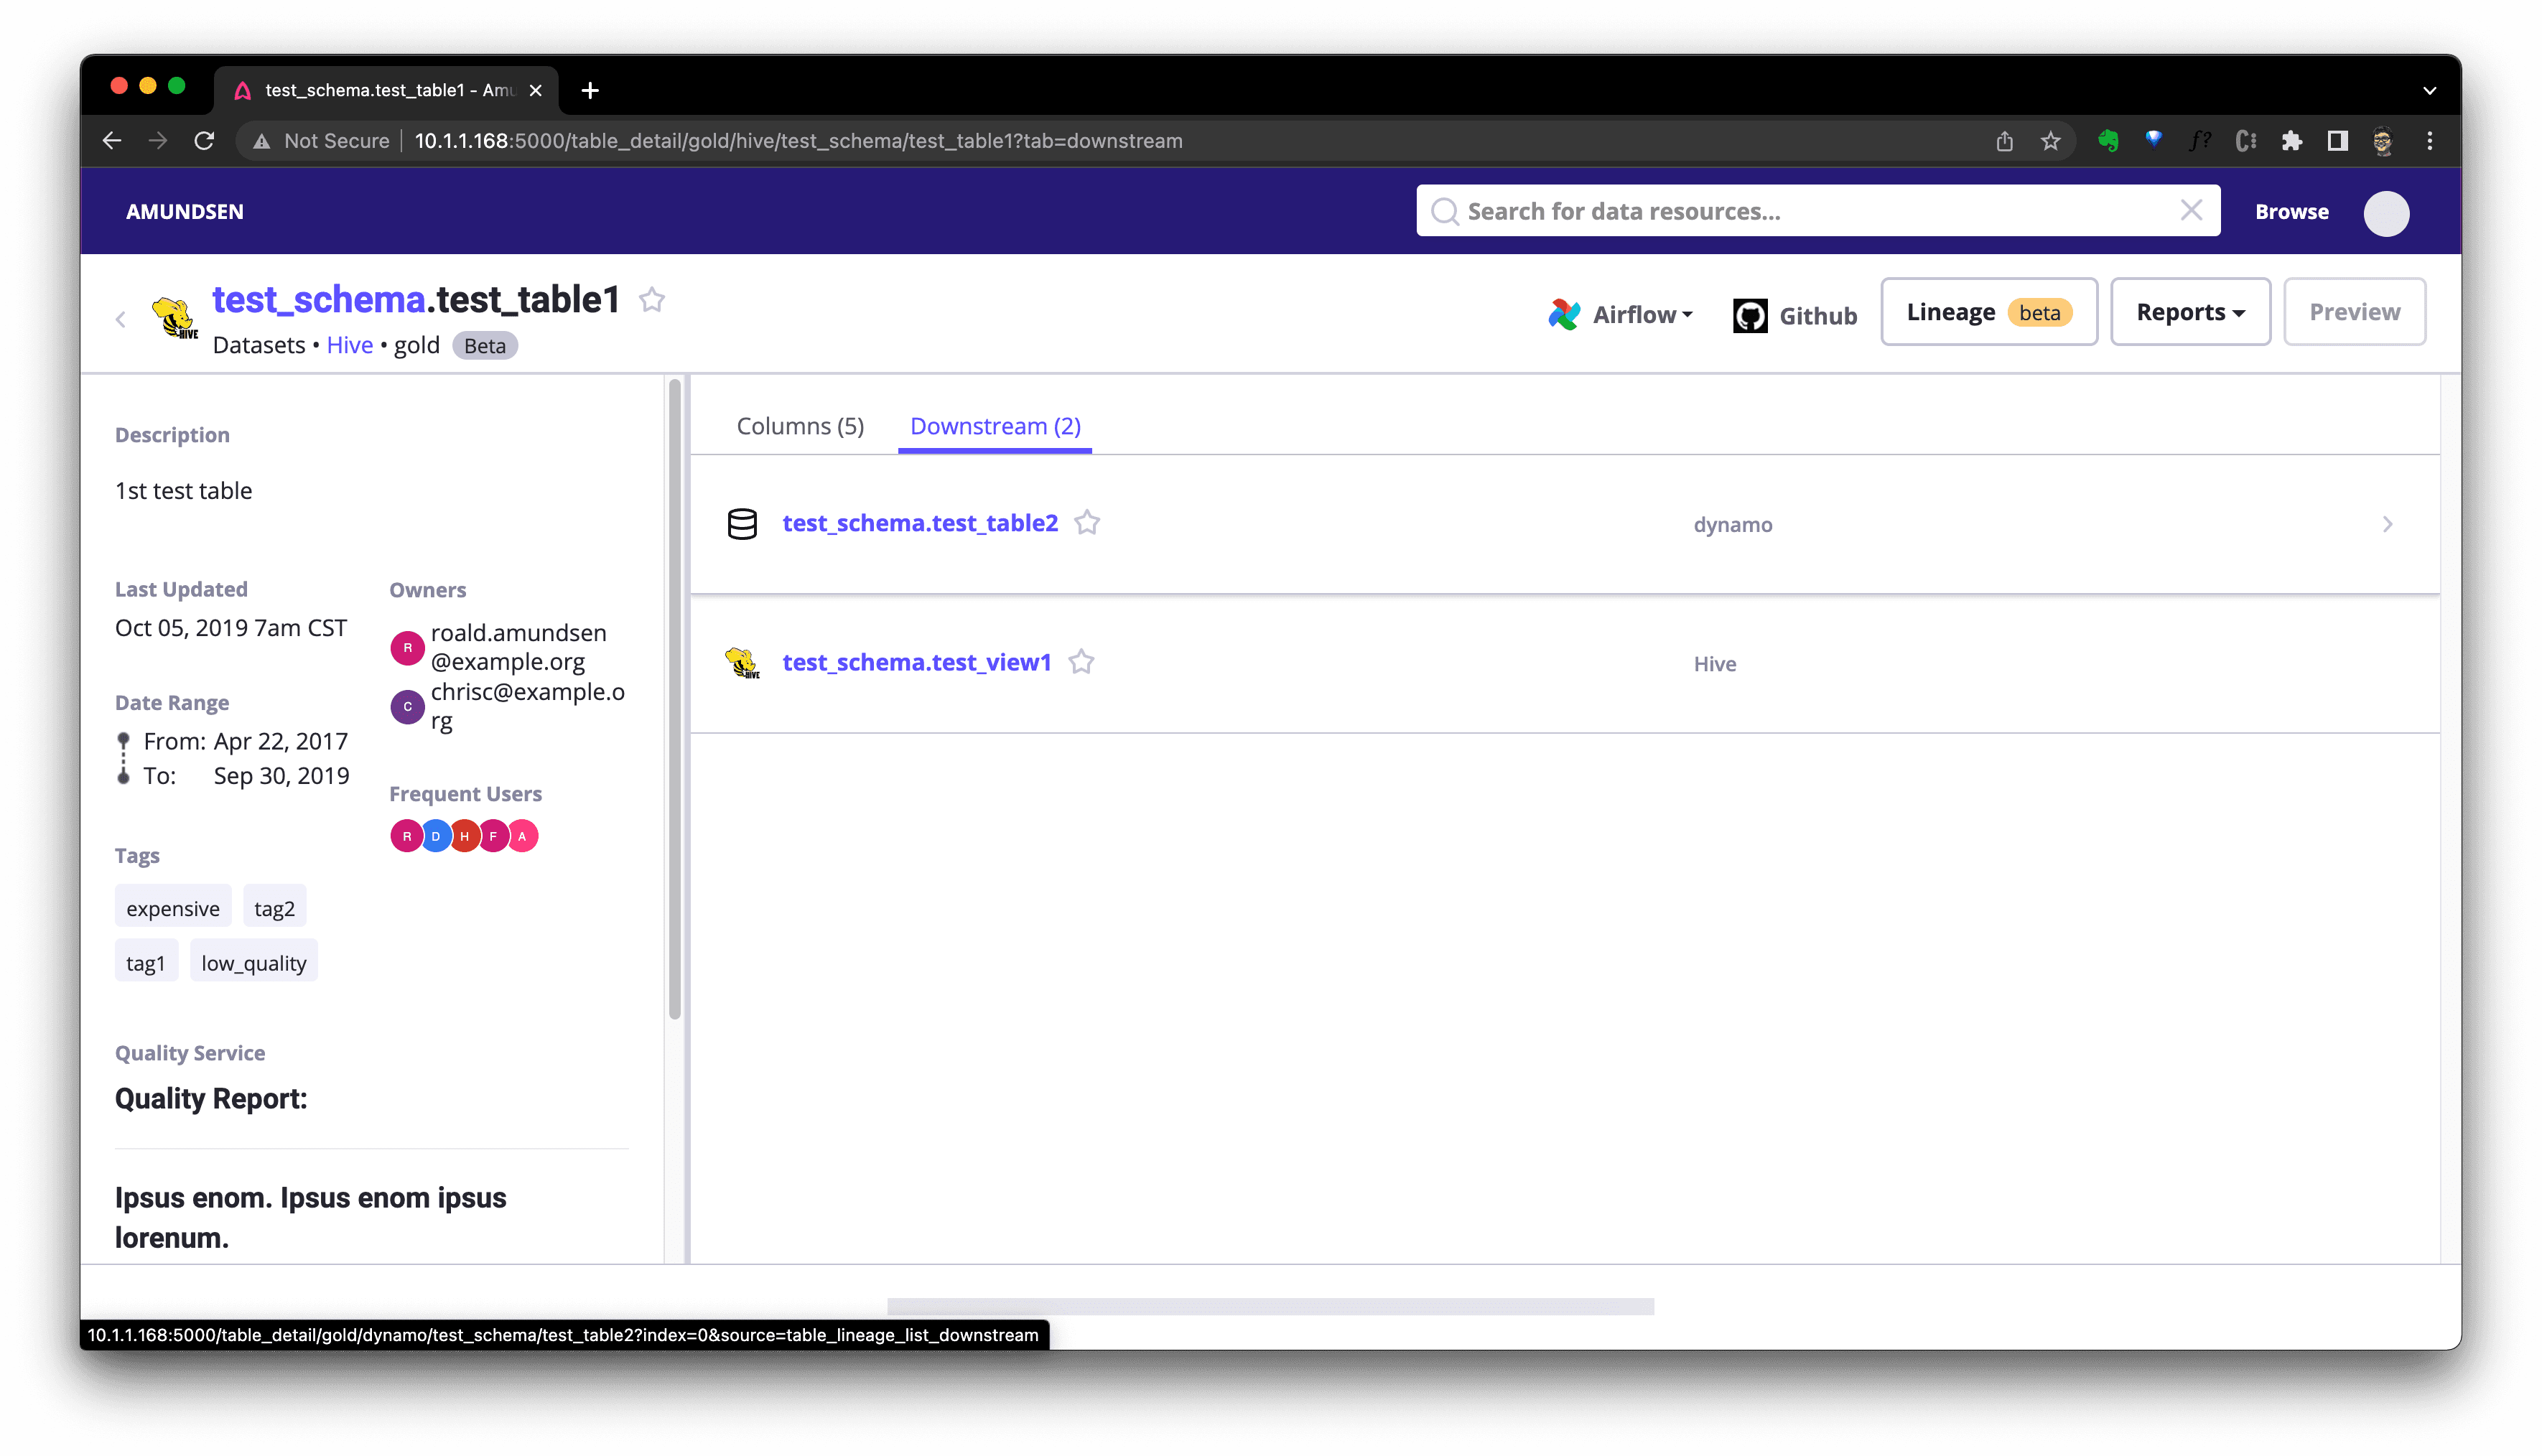
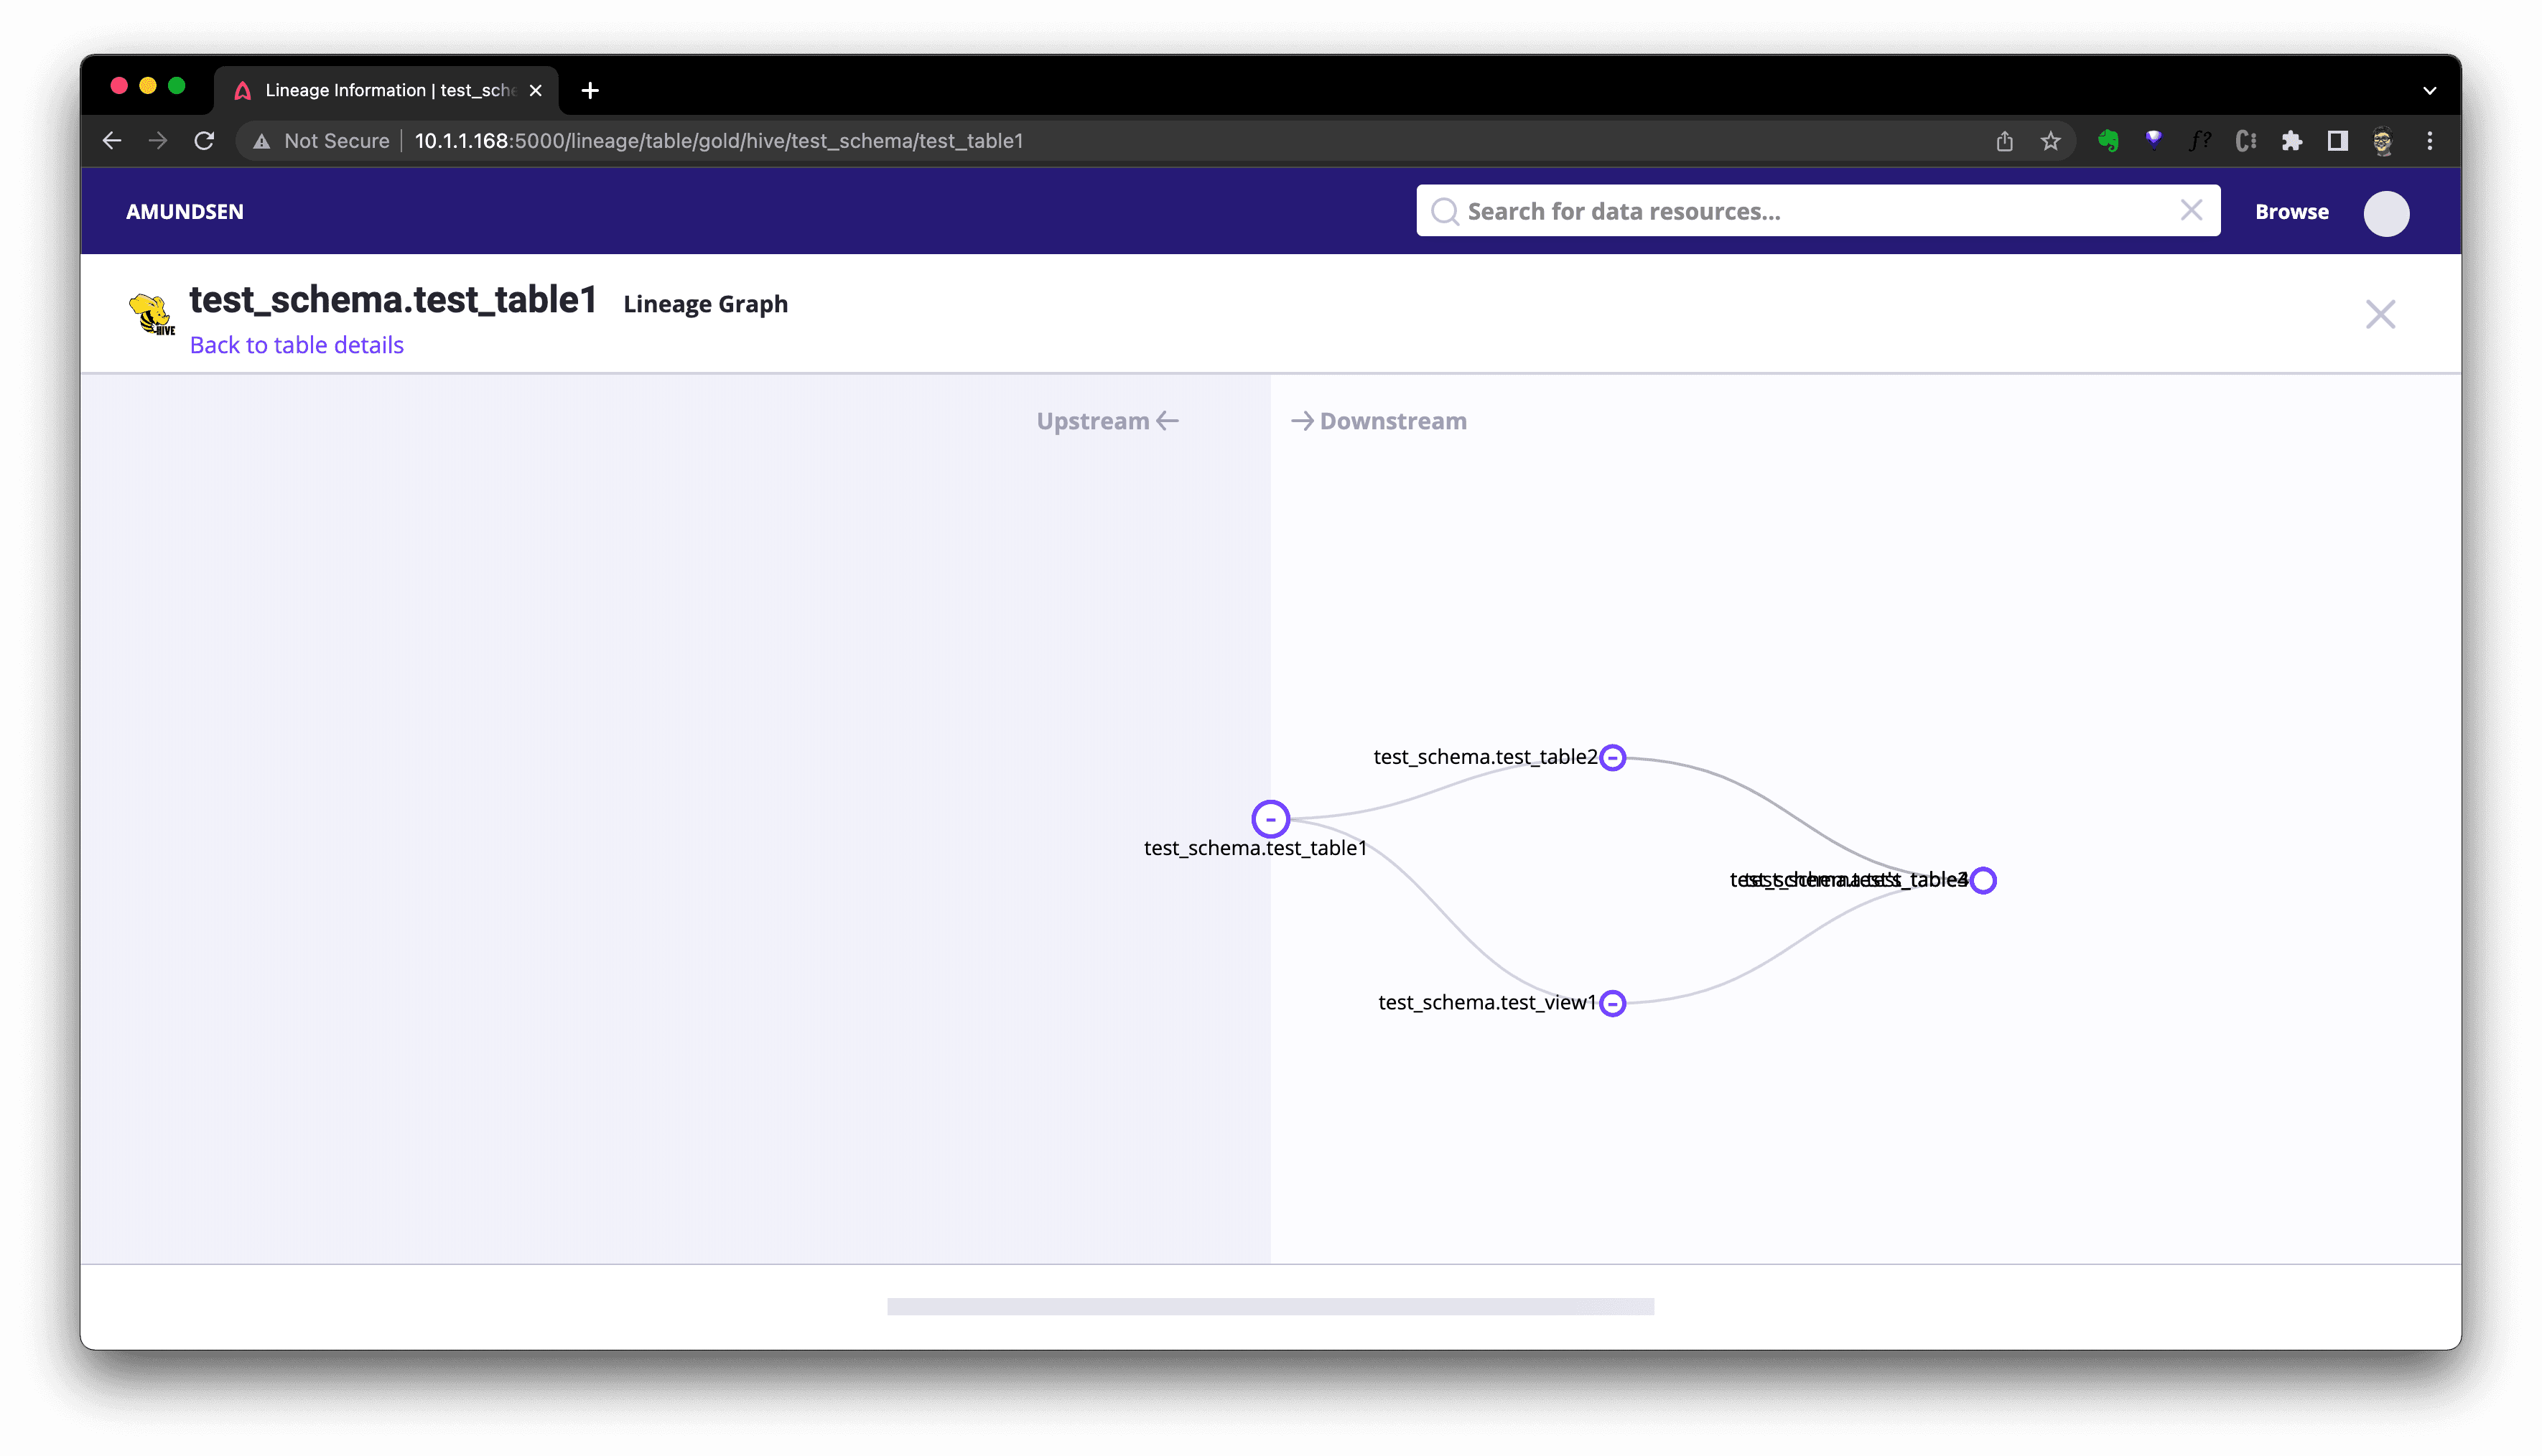
Or click Lineage to see the graph:
There are API for lineage query, too. Here is an example to query that with cURL, where we leverage the netshoot container as we did before for user creation.
The above API call was to query linage on both upstream and downstream direction, with depth 3 for table snowflake://dbt_demo.public/raw_inventory_value.
And the result should be like:
In fact, this lineage data was just extracted and loaded during our DbtExtractor execution, where extractor.dbt.{DbtExtractor.EXTRACT_LINEAGE} by default was True, thus lineage metadata were created and loaded to Amundsen.
Get lineage in NebulaGraph
Two of the advantages to use a Graph Database as Metadata Storage are:
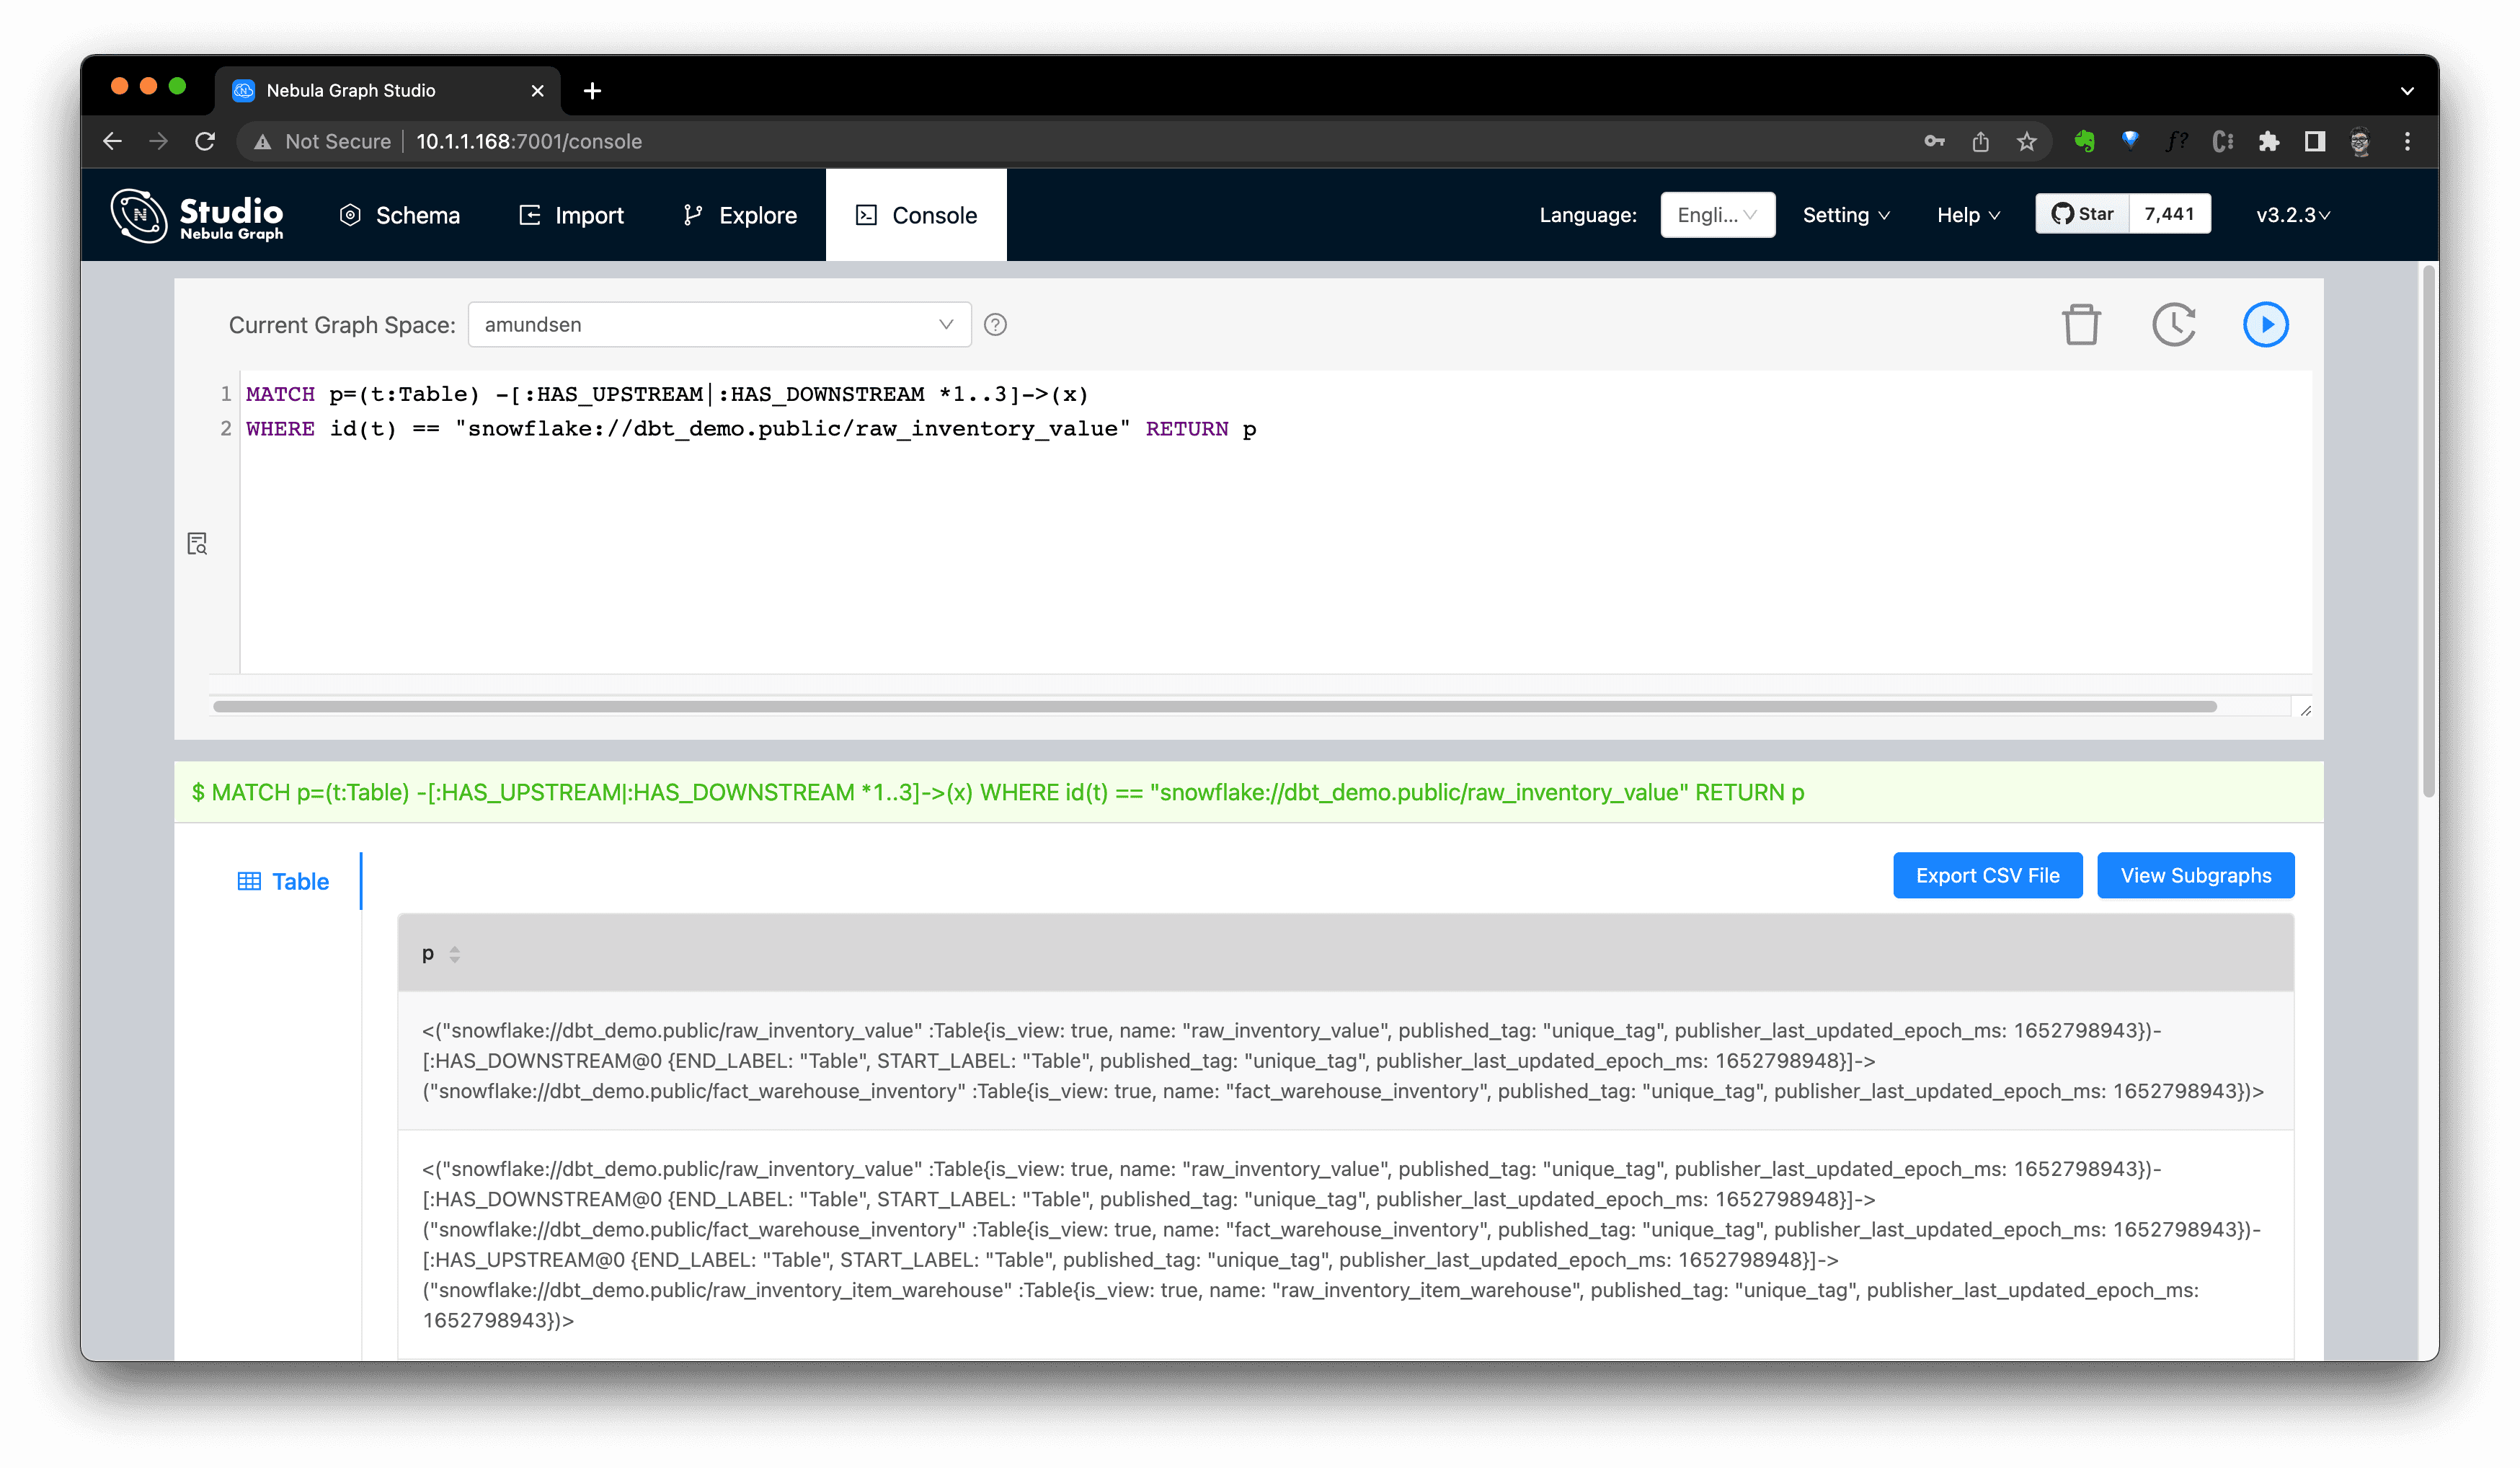
The graph query itself is a flexible DSL for lineage API, for example, this query helps us do the equivalent query of the Amundsen metadata API for fetching lineage:
We could now even query it in NebulaGraph Studio's console, and click
View Subgraphsto make it rendered in a graph view then.
Extract Data Lineage
Dbt
As mentioned above, DbtExtractor will extract table level lineage, together with other information defined in the dbt ETL pipeline.
Open Lineage
The other linage extractor out-of-the-box in Amundsen is OpenLineageTableLineageExtractor.
Open Lineage is an open framework to collect lineage data from different sources in one place, which can output linage information as JSON files to be extracted by OpenLineageTableLineageExtractor:
Recap
The whole idea of Metadata Governance/Discovery is to:
Put all components in the stack as Metadata Sources(from any DB or DW to dbt, Airflow, Openlineage, Superset, etc.)
Run metadata ETL with Databuilder(as a script, or DAG) to store and index with NebulaGraph(or other Graph Database) and Elasticsearch
Consume, manage, and discover metadata from Frontend UI(with Superset for preview) or API
Have more possibilities, flexibility, and insights on NebulaGraph from queries and UI
Upstream Projects
All projects used in this reference project are listed below in lexicographic order.
Amundsen
Apache Airflow
Apache Superset
dbt
Elasticsearch
meltano
NebulaGraph
Open Lineage
singer
Feature Image credit to Phil Hearing
