Development Tools
Sep 22, 2021
Ecosystem Tools: NebulaGraph Dashboard for Monitoring
Nico
Data is crucial. To ensure the reliability and stability of online services, and thus to ensure data security, you should monitor the hardware resources, performance, and services of the servers, and perform daily statistical analysis. Therefore, once a server fails, you can quickly troubleshoot and resolve failures by viewing the monitoring information.
NebulaGraph Dashboard (Dashboard in short) is a visualization tool that displays information of the machines of a NebulaGraph cluster and its services, which can be used for data analysis and service monitoring. On Dashboard, you can view the metrics of the hardware and the NebulaGraph services on each machine, and analyze and monitor the service status during the specified period. The information helps you manage, operate, and maintain the services better and more visually.
Machine Monitoring
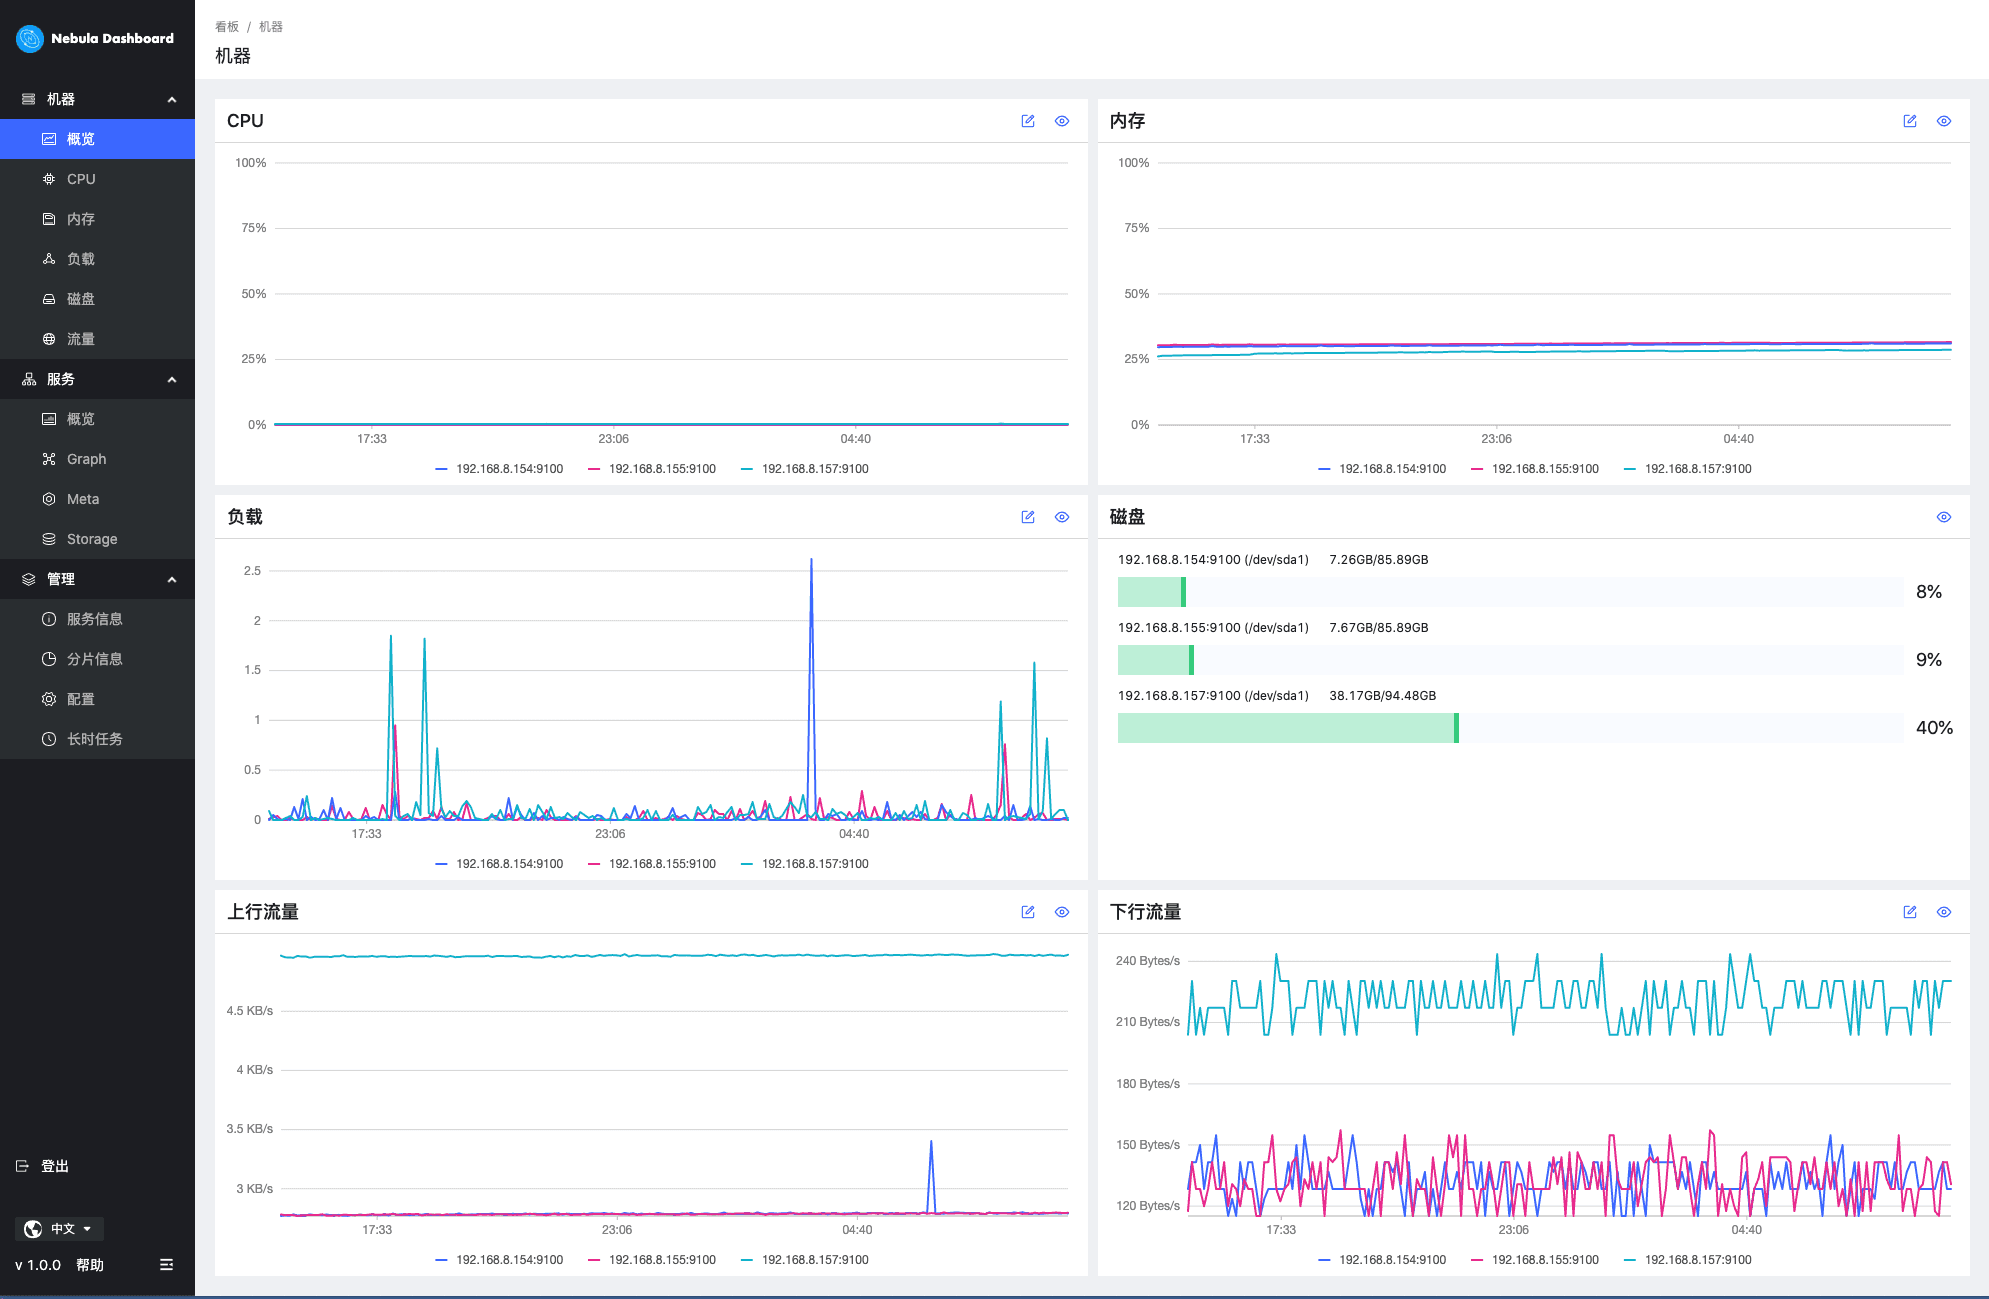
On Dashboard, you can monitor and then view the metrics of the machines in a NebulaGraph cluster in a visual way, such as CPU, memory, load, disk usage, and network traffic.
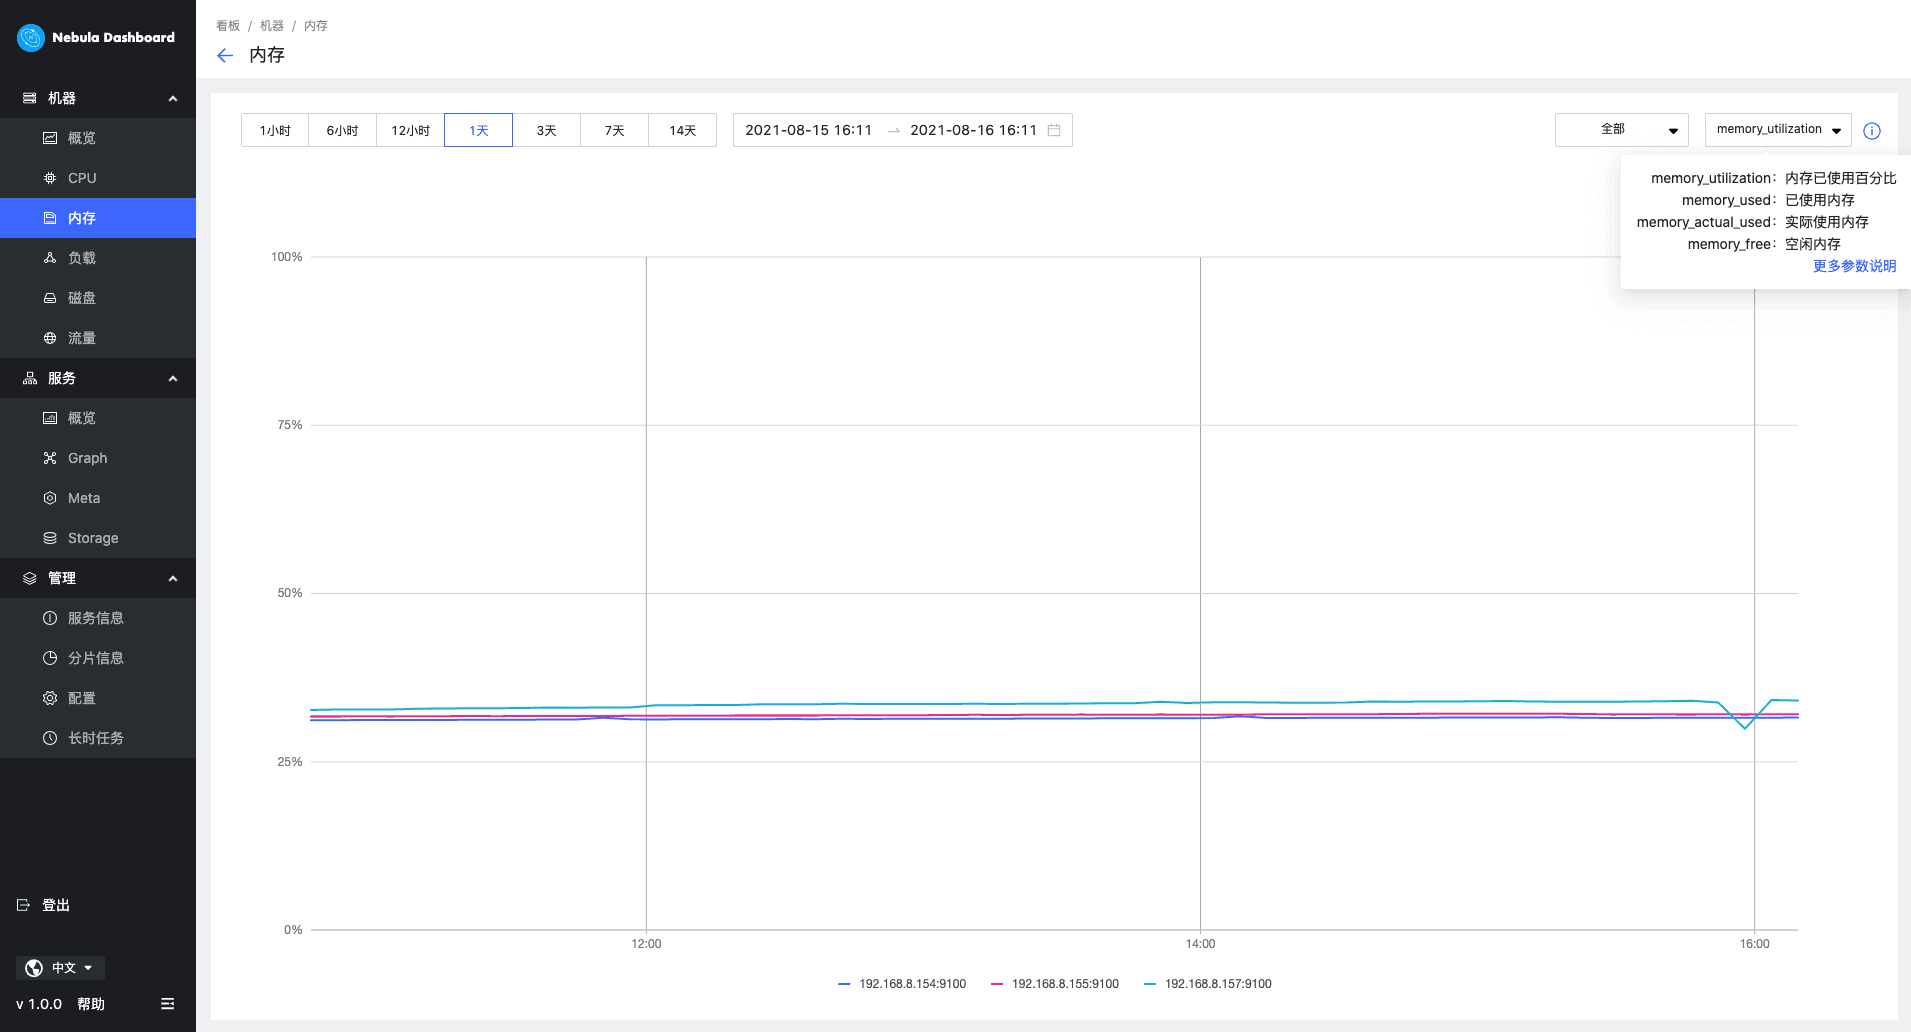
On each metric chart, you can view and monitor the metric by filtering the variables. Additionally, Dashboard supports filtering information by specifying periods or cluster nodes. By zooming in or out the view, setting the baseline (for reference), reading the instructions on a metric variable, and so on, you can analyze the monitoring data.
Service Monitoring
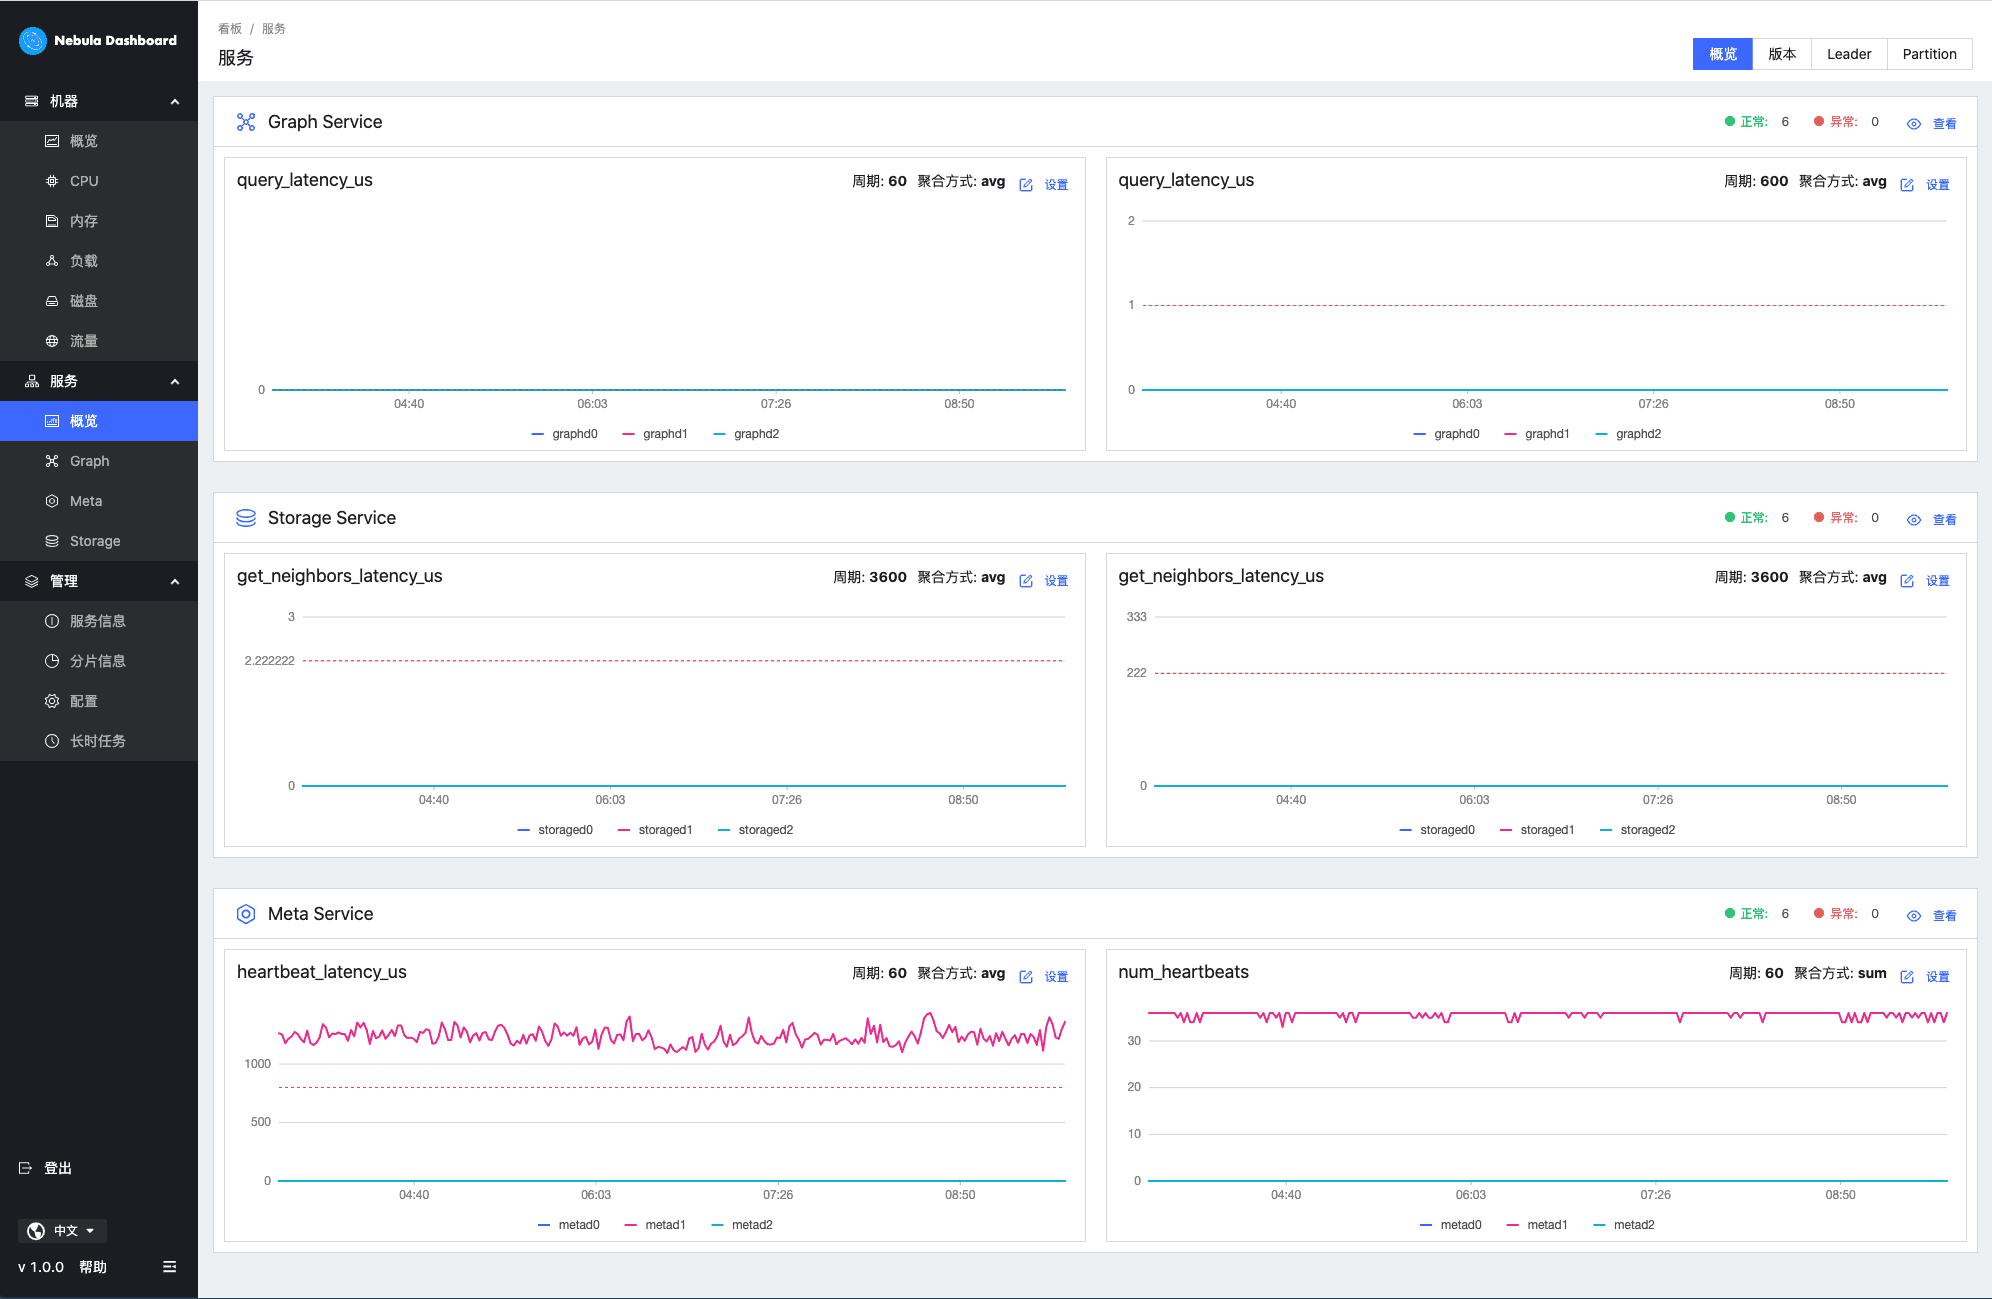
The Service module monitors the Graph, Meta, and Storage services of NebulaGraph. By clicking the Overview tab, you can view the number of each service in different statuses, and analyze a service by comparing its two metrics.
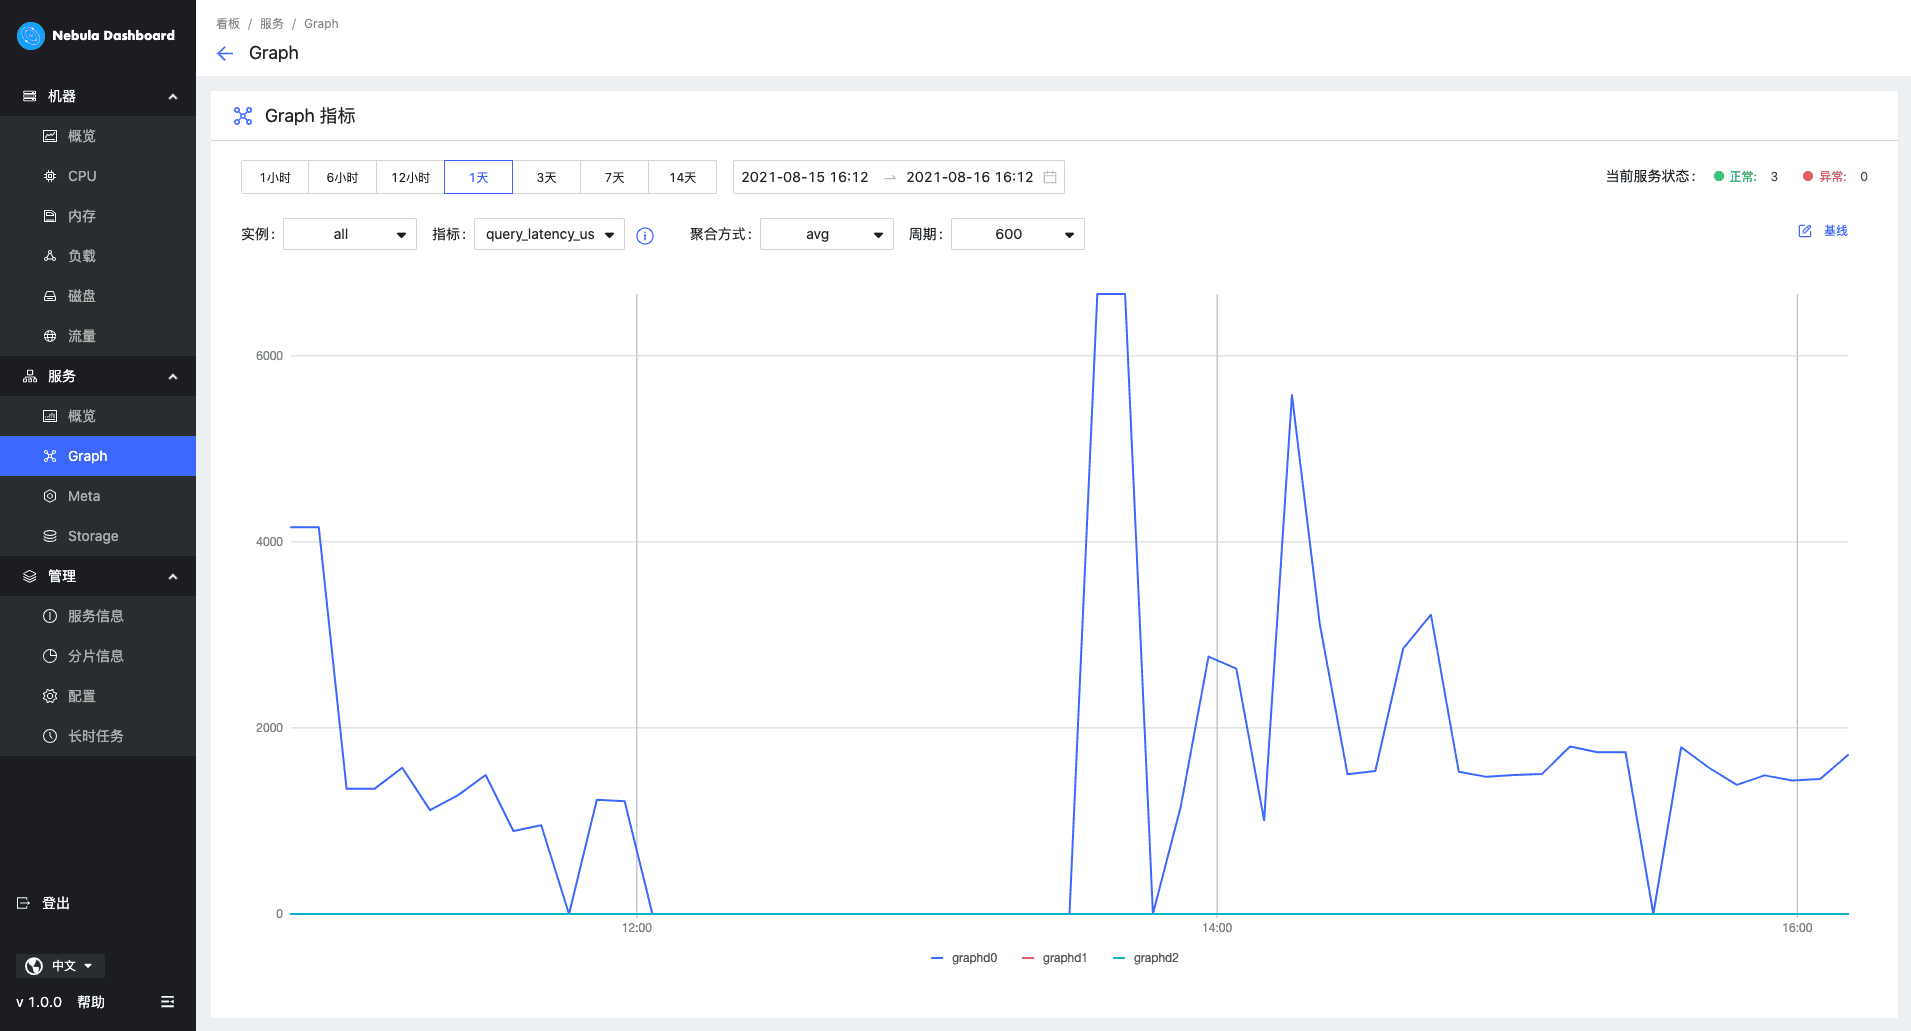
By clicking the tab for a specific service, Dashboard can display the service details according to the specified metric (variables) or period. Additionally, it supports filtering information by specifying time range, period, or cluster nodes.
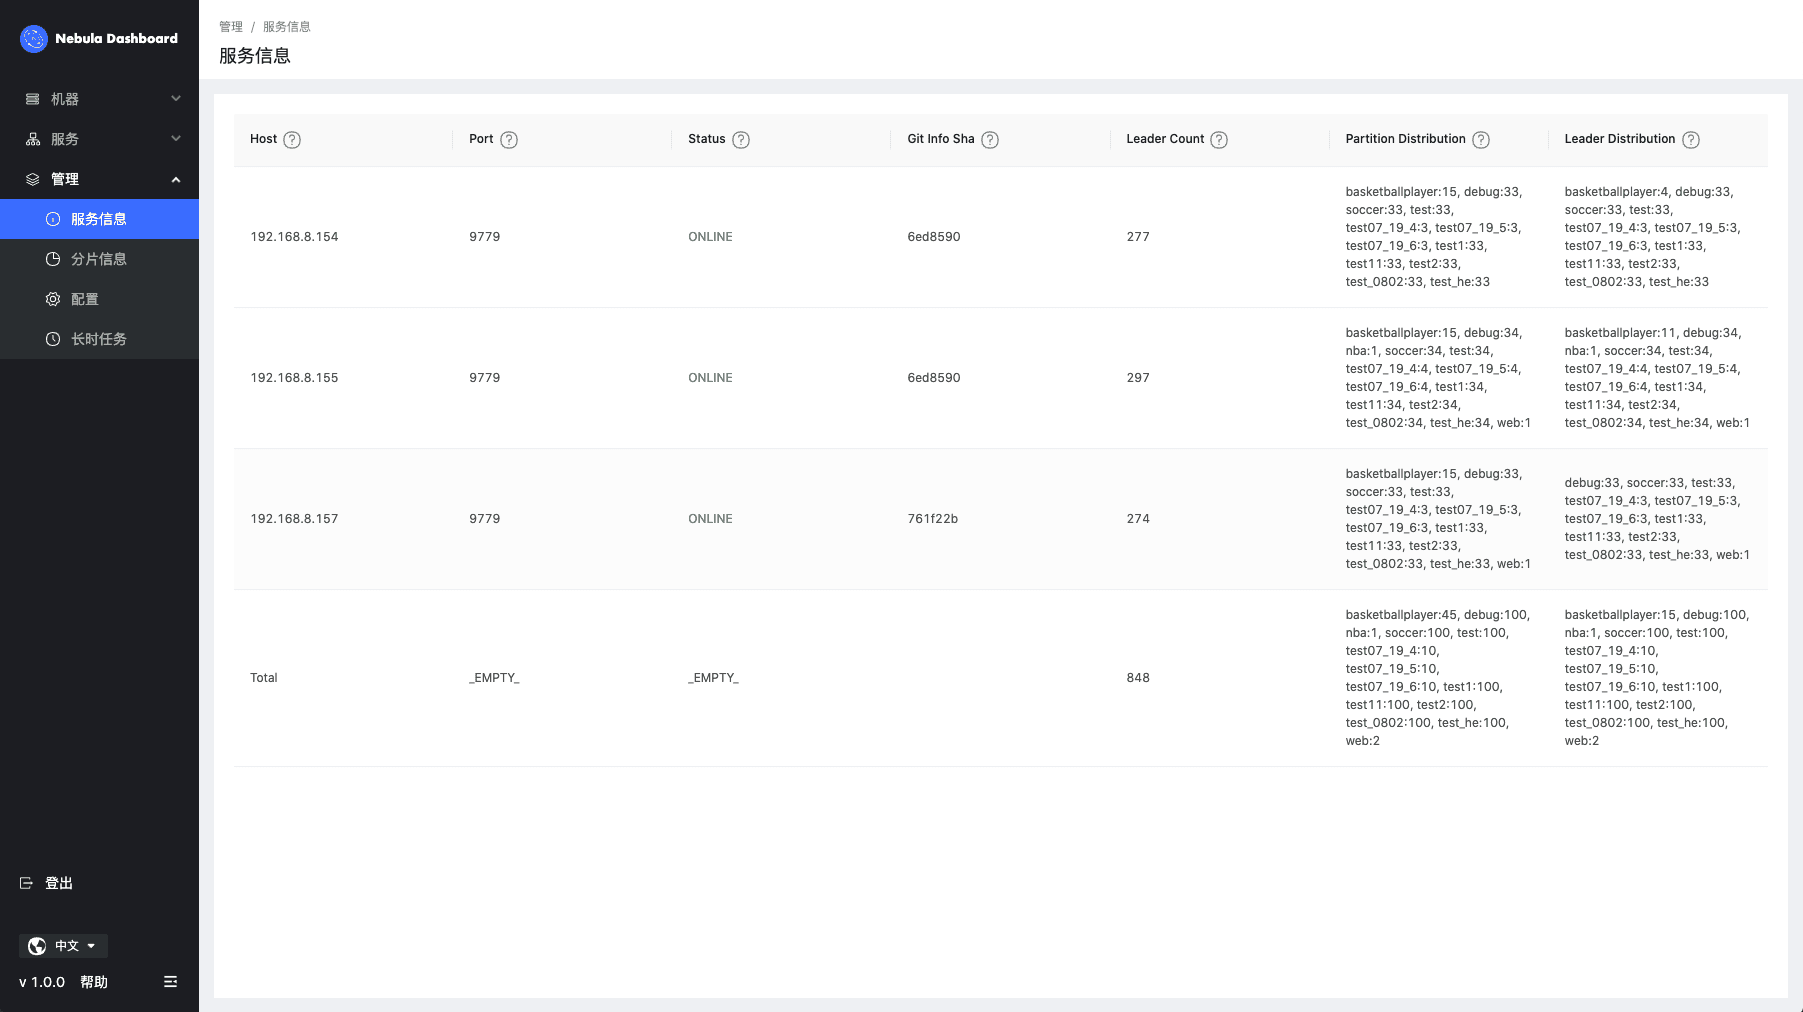
In the Management tab, you can view the query and partition information of the specified graph space. Besides, this module displays the configurations of each service, such as Storage Service or Graph Service, and the job information.
Roadmap
The Dashboard team is focusing on supporting queries for machine and service information by specifying multiple metrics, and also working to enable it to support representing the results graphically and the visual and interactive operations on a drawing board for analyzing metrics. In the future, the team will develop more new features such as setting alarm thresholds for a specified metric.
NebulaGraph Dashboard is open-source, and you can find its source code at https://github.com/vesoft-inc/nebula-dashboard. If you are interested in developing monitoring and visualization tools, and you have some ideas about them, please participate with us as a Dashboard Contributor to build a better monitoring tool.
If you want to learn more about NebulaGraph, please refer to "NebulaGraph Database Manual" to troubleshoot the problem. It records in detail the knowledge points and specific usage of the graph database and the graph database NebulaGraph.
Here is the Manual link: https://docs.nebula-graph.io/2.5.0/pdf/NebulaGraph-EN.pdf
Join our Slack channel if you want to discuss with the rest of the NebulaGraph community!
