PerformanceArchitecture
When NebulaGraph Slows Down: Diagnosing Storage-Related Performance Issues
Storaged, the core storage component of NebulaGraph, is responsible for ensuring durability, availability, and scalability. It plays a critical role in handling reads and writes efficiently. This article explores the architecture of Storaged from the perspective of its underlying storage engine, RocksDB [1], and shares insights from real production use cases on diagnosing and resolving performance bottlenecks.
One notable production example is Snapchat, which uses NebulaGraph to enhance its friend recommendation system at scale. (Read more here.)
How is data read and written in NebulaGraph
In NebulaGraph, both vertices and edges are stored as key-value pairs using RocksDB as the storage engine. In version 3.x, we use RocksDB 3.7.3. The data is partitioned and replicated, with each partition replica backed by a separate RocksDB instance.
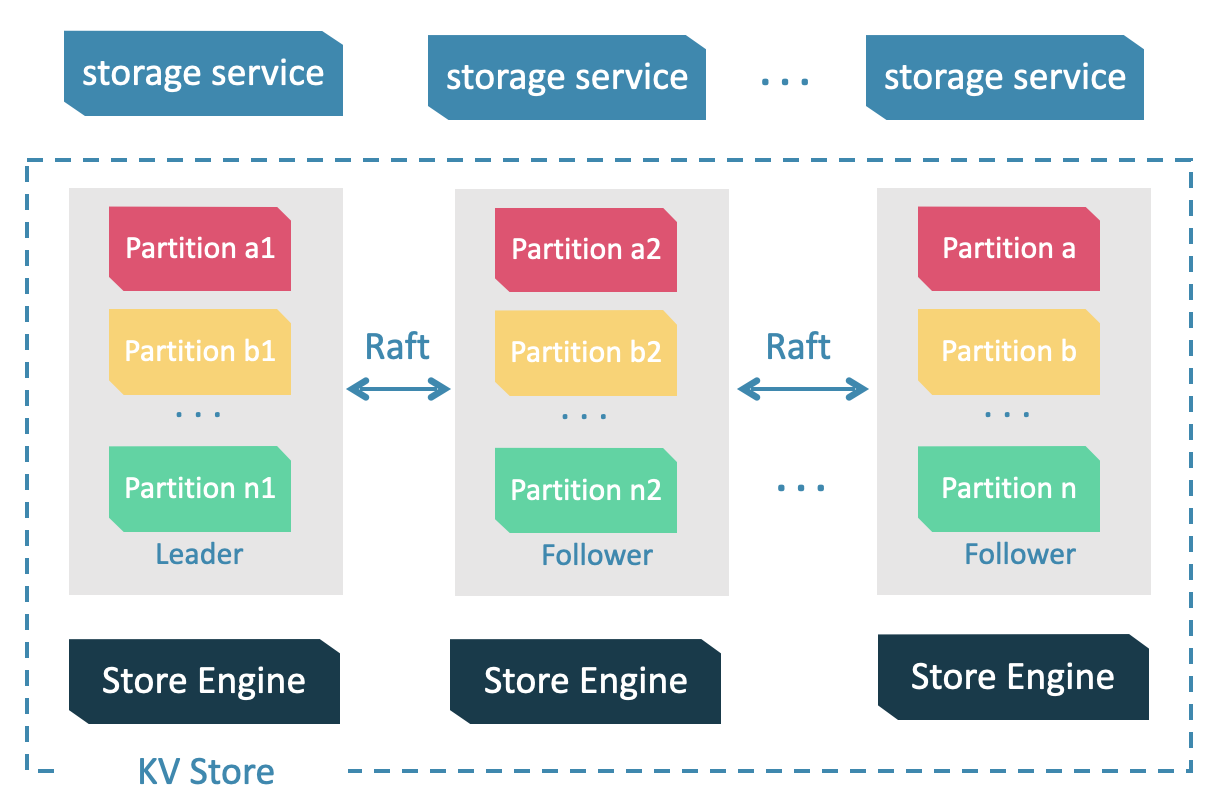
To distribute data across multiple storage nodes, we use hash function:
- Vertices are partitioned based on their vertex ID.
- Edges are partitioned based on the source vertex ID.
This design ensures that a vertex and all its outgoing edges reside in the same partition, improving query performance. However, super nodes (e.g., highly connected entities such as celebrities or popular websites) can cause load imbalances. Hashing helps distribute these nodes more evenly across Storaged instances.
Consistency and Replication via Raft
To maintain consistency between replicas, NebulaGraph employs the Raft consensus algorithm [2], which elects a Leader among the replicas. The Leader handles most read and write requests, while Followers serve as backups. If a Leader fails due to network issues or maintenance, a new Leader is elected.
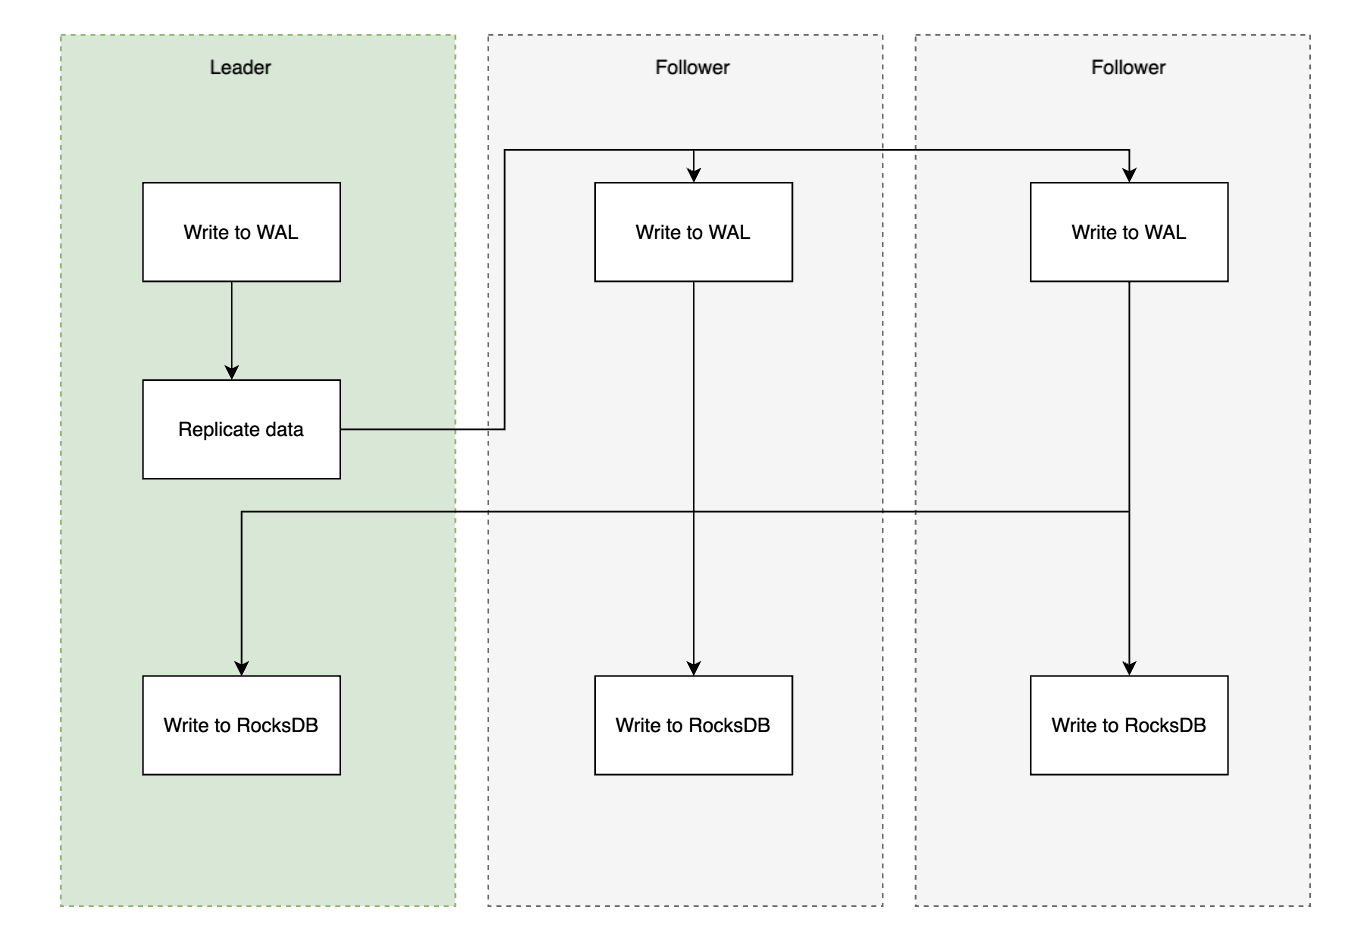
The data write and replication process follows these steps:
- The Leader writes data to the Write-Ahead Log (WAL).
- The write is replicated to all Followers, who also write to their own WAL.
- Followers asynchronously persist the data to RocksDB and acknowledge the Leader.
- Once the Leader receives acknowledgments from all Followers, it commits the write to RocksDB.
The diagram below illustrates this process.
High Availability with Zones
For environments requiring high availability, we recommend distributing partition replicas across different zones. A zone refers to a distinct logical or physical grouping of infrastructure. In cloud environments, zones typically correspond to availability zones (AZs) [3] - geographically separate data centers within a region. These zones are close enough to support low-latency connections but far enough apart to minimize the risk of simultaneous failures due to localized disruptions (e.g., power outages or extreme weather). In this setup:
- Writes are always handled by the Leader, regardless of zone placement.
- Reads can be optimized with zone affinity, where queries prioritize a Storaged instance within the same zone as the compute node (Graphd) handling the query.
- With zone affinity enabled, both Leaders and Followers can serve read requests, improving efficiency and reducing cross-zone data transfer costs. (E.g., In AWS, intra-zone data transfer is free.)
Diagnosing High Storaged Latency: Common Causes and Solutions
In production environments, high P90 query latency and increased query failures often signal performance issues. While some problems originate from Graphd (our compute nodes) or Metad (our meta service nodes), when the root cause lies in Storaged, it always manifests as high storage latency. This section covers the most common causes of high storage latency and how to mitigate them.
1. Low Resource Utilization
If Storaged latency is high, but CPU usage, disk I/O, and disk throughput remain low, the software may not be fully utilizing available hardware resources. A key area to check is thread allocation for the Thrift server and RocksDB.
Storaged relies on three main thread pools:
- Thrift IO thread pool – Handles incoming connections in an event loop.
- Thrift worker thread pool – Handles service requests, including writes.
- Read handler thread pool – Manages disk reads via RocksDB.
The Thrift IO threads process the connections very fast and rarely cause latency issues. If latency persists, focus on the worker and read handler pools. In production, setting these pools to match the number of CPU cores on the machine or pod running Storaged typically yields optimal performance.
2. High CPU usage
If high CPU usage is observed across all Storaged instances, the root cause likely falls into one of the following categories.
(1) CPU Spikes During Data Ingestion
If high CPU usage occurs primarily during data ingestion, the most likely cause is RocksDB compaction [4]. Compaction is an essential process that merges and reorganizes data in RocksDB’s Log-Structured Merge Tree (LSM tree) to optimize read performance. However, it can be resource-intensive.
To mitigate excessive CPU usage during compaction, consider the following optimizations:
- Reduce compaction concurrency:
- Lower
max_subcompactionsandmax_background_jobsto slow down compaction and distribute CPU load more efficiently.
- Lower
- Optimize custom compaction filtering:
- In NebulaGraph, expired data is garbage-collected using a custom compaction filter [5] when TTL is enabled [6]. This filter scans affected vertices and edges during compaction and verifies whether their TTL has expired. This additional check incurs CPU overhead.
- The config
min_level_for_custom_filterdetermines at which LSM level the custom compaction filter starts processing data. - A lower value of
min_level_for_custom_filterwill scan more levels of data and thus increase CPU load. - A higher value of
min_level_for_custom_filterpostpones TTL filtering to later stages, which reduces CPU usage but increases the temporary retention of expired data.
Since an excessively high value of min_level_for_custom_filter can result in bloated storage and potential availability issues, careful fine-tuning is necessary. The goal is to determine an optimal value that balances CPU efficiency with the retention of expired data. We will explore the impact of accumulated expired data later in this article.
(2) Persistent High CPU Usage, Regardless of Writes
If high CPU usage persists even when there are no active writes, the cause is likely related to RocksDB read operations or thread contention within Storaged. To diagnose the issue more precisely, we recommend running perf top on a high-CPU Storaged instance.
- On physical or virtual machines, running
perf topis straightforward. - On Kubernetes deployments, additional privilege changes are required. Our Nebula Operator [7] includes the necessary configurations and can enable
perf topwith a single setting.
If perf top shows excessive thread context switching and preemption occurring within Thrift’s internal queues, this indicates over-threading - too many active threads competing for CPU resources. Reducing the number of worker and read handler threads can improve CPU efficiency.
3. High Disk I/O Utilization
If IOPS or I/O throughput reaches the disk's limits, query latency can degrade significantly. Identifying the underlying cause is crucial for maintaining performance.
(1) High I/O During Data Ingestion
If excessive disk I/O occurs only during data ingestion, the likely causes are:
- High data ingestion speed
- High compaction concurrency
To alleviate this, consider:
- Reducing ingestion speed or adjusting the batch size
- Lowering the values of
max_subcompactionsandmax_background_jobsto limit compaction concurrency
(2) Constantly High I/O with Storage Errors
If disk I/O remains persistently high and approaches the disk's limit, and error logs such as RPC failure in StorageClient with timeout or loadshedding appear in Graphd, this likely indicates excessive amount of expired data..
In this case, Storaged is scanning the disk excessively to filter out expired data, which significantly increases I/O load. To verify this, check the statistics by running:
SUBMIT JOB STATS;
SHOW STATS;
If the amount of stale data is twice the normal level or higher, trigger a full compaction to clean up expired data:
SUBMIT JOB COMPACT;
Conclusion
Storaged is a critical component of NebulaGraph, and its performance directly impacts query latency and system stability. This article provided insights into how data is stored, partitioned, replicated, and accessed in Storaged, along with best practices for diagnosing and resolving high storage latency.
Reference
[1] Rocksdb. https://github.com/facebook/rocksdb
[2] Raft. Ongaro, Diego, and John Ousterhout. "In search of an understandable consensus algorithm." 2014 USENIX annual technical conference (USENIX ATC 14). 2014.
[3] Availability Zone. https://learn.microsoft.com/en-us/azure/reliability/availability-zones-overview?tabs=azure-cli
[4] Rocksdb Compaction. https://github.com/facebook/rocksdb/wiki/Compaction
[5] Compaction Filter. https://github.com/facebook/rocksdb/wiki/Compaction-Filter
[6] TTL in NebulaGraph. https://docs.nebula-graph.io/3.8.0/3.ngql-guide/8.clauses-and-options/ttl-options/
[7] Nebula Operator. https://github.com/vesoft-inc/nebula-operator