NebulaGraph Analytics: Scalable Enterprise Graph Computing for the AI Era
NebulaGraph
Graph Computing
A global banking organization was looking to increase their application of native-graph technology but was struggling to gain internal commitment for a wholesale move to a graph database. They found a path forward by identifying a critical community detection use case within their Fraud team that was previously out of reach given the size of their data set and the multiple relational technologies being used to store the data. They introduced graph technology by deploying NebulaGraph Analytics with its low barrier of entry and credit-based pricing model to build and run a custom Leiden algorithm. The ability to cost effectively and efficiently scale graph computing to demanding analytical workloads without having to relocate their data was a key reason the company chose NebulaGraph Analytics.
This example highlights an important shift in how enterprises are using graph technology. As connected data continues to grow, organizations need both real-time graph processing for operational applications and large-scale graph analytics for offline, computationally intensive workloads. These are different scenarios with different requirements, and both are becoming increasingly important in the AI era.
NebulaGraph Analytics provides a scalable graph computing and analytics platform designed to help enterprises process large graph datasets, run complex algorithms, support iterative analysis, and integrate graph analytics into production data and AI workflows.
Why Large-Scale Graph Analytics Matters in the AI Era
Modern enterprises generate data with increasingly complex relationships. Graph analytics is used when organizations need to perform computationally intensive analysis across a large graph, run sophisticated algorithms, discover patterns, or generate features for downstream applications. These workloads may involve millions or billions of relationships and can require substantial computation, iteration, and experimentation.
In the AI era, this analytical capability is becoming increasingly valuable because graph analytics can generate relationship-aware features and signals for machine learning and AI applications. Algorithms such as community detection, centrality, similarity, node embedding, and link prediction can help organizations transform connected data into scores or signals that can be used by analytical models and AI workflows.
This is why modern graph architectures increasingly need two complementary layers:
Real-time graph processing supports operational applications and low-latency relationship queries, while scalable graph analytics supports deep computation, machine learning, and AI-driven analysis.
NebulaGraph Analytics is designed to provide the second layer.
From Fraud Detection to AI: Where Graph Analytics Delivers Value
Graph analytics becomes particularly valuable when relationships contain important business signals.
Use Cases for Graph Analytics
In fraud detection, graph analytics can identify suspicious communities, detect unusual relationship patterns, analyze transaction networks, trace connections between seemingly unrelated entities, and surface hidden clusters and behavioral patterns.
In fund-flow analysis, graph analytics makes it possible to analyze complex fund-flow networks, identify suspicious routes, trace multi-hop dependencies, and understand how entities are connected through financial activity.
For customer intelligence and recommendation, graph analytics can identify similar entities, influential customers, behavioral communities, and potential relationships that can support more intelligent recommendations.
In infrastructure and systemic risk analysis, graph-based computation can reveal critical nodes, hidden dependencies, and relationship-driven risk propagation across complex environments. This enables teams to move from isolated asset monitoring to a more comprehensive view of systemic and relationship-based risk.
AI and Machine Learning
Across these use cases, graph analytics can also feed downstream AI and machine learning workflows. For example, fraud teams can use community IDs, centrality scores, similarity signals, or node embeddings as features in risk models; recommendation teams can use graph similarity and relationship patterns to improve ranking or personalization. In this way, NebulaGraph Analytics helps turn connected data into reusable signals for AI systems.
In production scenarios, the common challenge is often scale. As graph datasets grow to billions of relationships, organizations need a platform that can scale deep graph computation without making analysis prohibitively expensive or operationally complex.
NebulaGraph Analytics: A Platform for Production-Scale Graph Analytics
NebulaGraph Analytics is an enterprise graph computing and analytics platform built for large-scale graph datasets and complex analytical workloads. It provides the capabilities needed to move from graph data to analytical results—from data loading and algorithm development to scalable execution, resource management, and result delivery.
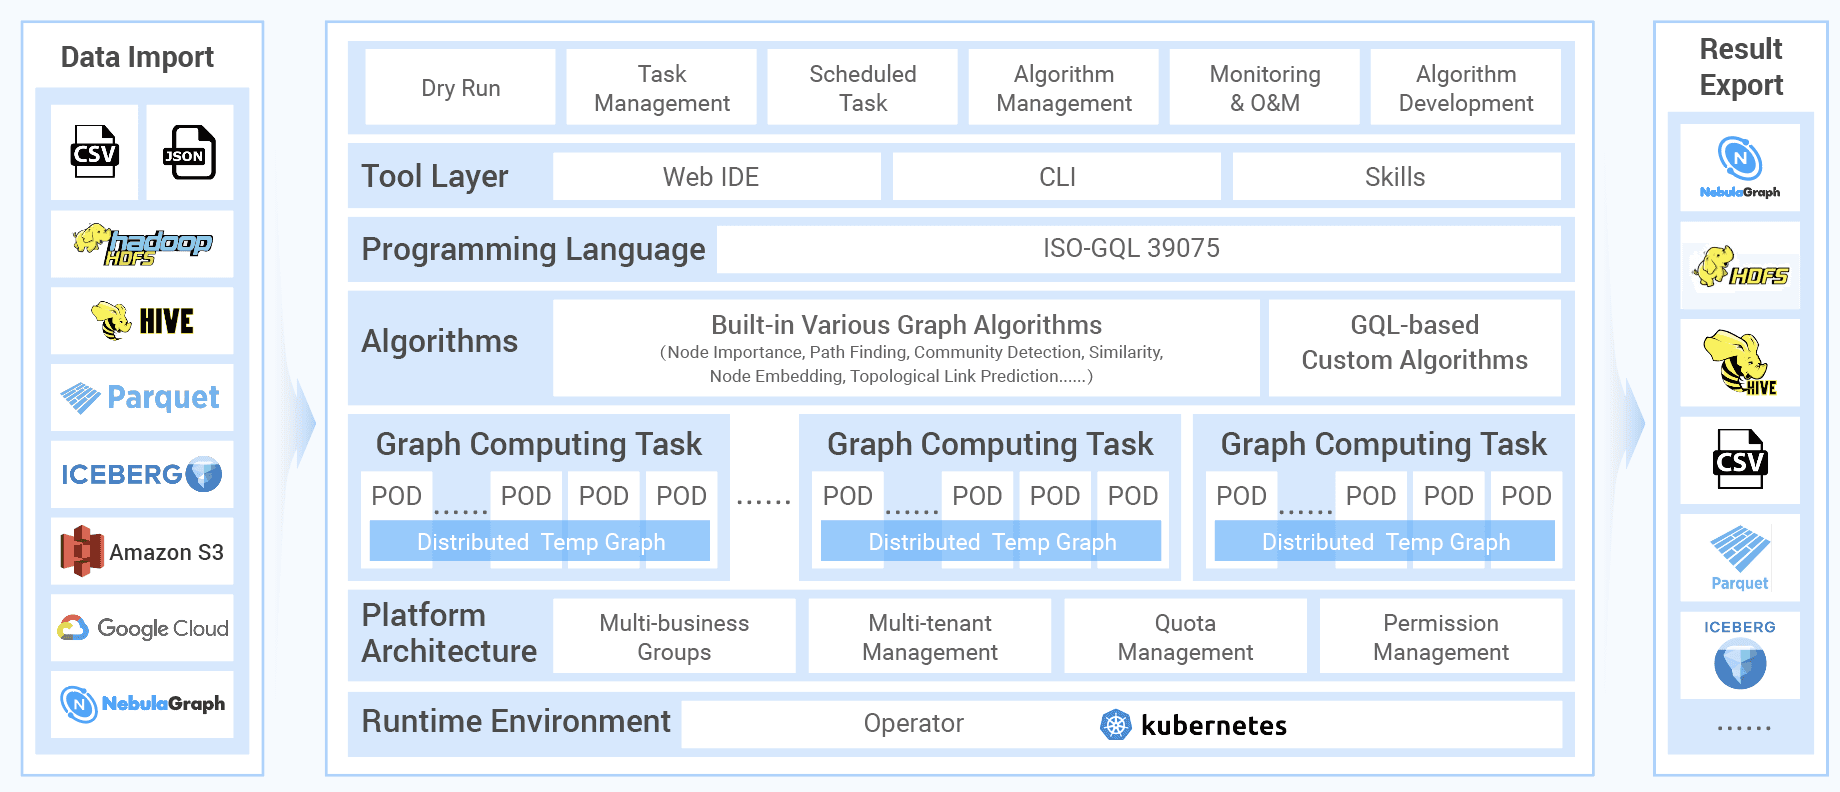
Fig.: NebulaGraph Analytics v5.3 Architecture
Scalable and High-Performance Graph Computing
Large-scale graph analytics can involve billions of relationships and computationally intensive algorithms. NebulaGraph Analytics is designed to handle these workloads efficiently through a job-based execution model.
When a job starts, the platform provisions the required compute resources, loads graph data into an in-memory temporary graph, executes the computation, and releases resources when the job finishes. This approach is well suited to analytical workloads that require significant compute capacity but do not need to run continuously.
In documented comparisons with Apache Spark GraphX, NebulaGraph Analytics can deliver 5x–10x better performance while using approximately 20% of the resources. For organizations running large graph workloads, this can translate into more than faster execution. Efficient graph computing can also help reduce infrastructure consumption and make more complex analyses economically practical.
Analyze Graph Data Without Moving Everything Into a Graph Database
One of the key advantages of NebulaGraph Analytics is its flexibility as a standalone graph analytics platform. It integrates naturally with NebulaGraph Database, but it does not depend exclusively on it as a data source.
NebulaGraph Analytics does not require organizations to move all analytical data into a graph database first. It can load graph data from enterprise data platforms and storage systems such as HDFS, Amazon S3, Google Cloud Storage, and Apache Iceberg, while supporting common formats including CSV, Parquet, and ORC.
This architecture gives data teams more freedom in designing their analytics pipelines. For example, an organization can run graph analytics directly against graph data stored in an object store or data lake and perform large-scale computation. Analytics results can also be exported back to systems such as S3, GCS, and HDFS, allowing downstream BI platforms, machine learning workflows, data pipelines, and audit processes to consume the results.
When NebulaGraph Database is already part of the architecture, it can also optionally serve as a first-class data source or destination. This allows organizations to combine real-time native-graph processing with large-scale graph analytics without requiring a single system to handle every workload.
Built-In Algorithms and Custom GQL Development
NebulaGraph Analytics provides a broad collection of built-in algorithms covering centrality, path finding, community detection, similarity, node embedding, and link prediction. These capabilities support a wide range of enterprise analytical scenarios while also providing useful building blocks for AI and machine learning workflows.
For specialized business requirements, developers can also create custom graph algorithms and analytical flows using GQL. A complete workflow can be packaged into a reusable procedure that combines graph preparation, computation, and result export.
This combination of built-in algorithms and custom development enables enterprises to apply graph analytics to established use cases, business-specific analysis, and AI flows.
Efficient Development, Automation, and Iteration
NebulaGraph Analytics 5.3.0 introduces capabilities designed to reduce the cost of developing and iterating on analytical workloads.
Dry Run mode allows teams to validate job configuration and analytical logic before committing resources to a full execution. This helps surface issues such as invalid logic, unreachable data sources, or incorrect input settings earlier in the workflow.
For iterative analysis, NebulaGraph Analytics supports resource reuse so teams can retain runtime resources and continue analyzing an already loaded graph rather than repeatedly rebuilding the environment. By avoiding repeated startup and data-loading overhead, teams can accelerate iterative analytical workflows and make large-scale graph exploration more efficient.
Analytics jobs can also be triggered manually, submitted through APIs, or scheduled to run automatically. With reusable procedures, API tokens, and robot accounts, teams can integrate graph analytics into CI/CD pipelines, scheduled data processing, internal platforms, and production data workflows.
Kubernetes-Native Architecture for Enterprise Scale
NebulaGraph Analytics is designed for modern cloud-native infrastructure and runs natively on Kubernetes. This architecture provides a scalable foundation for organizations that need to integrate graph analytics into existing cloud and platform environments while maintaining operational control.
Enterprise capabilities such as OAuth 2.0-based SSO, multi-tenancy, authentication, metadata management, and operator-based orchestration further support production deployments where multiple teams and workloads need to share a controlled analytics environment.
Lower the Barrier to Enterprise Graph Analytics
Large-scale graph analytics can appear difficult to adopt when organizations assume they must first migrate data, purchase dedicated infrastructure, and build a new operational environment. NebulaGraph Analytics is designed to lower these barriers.
Its ability to analyze data directly from existing data lakes and object storage means organizations can start with the data infrastructure they already have.
NebulaGraph Analytics also supports a CPU-second credit-based pricing model, allowing organizations to align analytics costs more closely with actual compute consumption. This is particularly relevant for analytical workloads that are intensive but run periodically rather than continuously. Instead of maintaining a large amount of dedicated capacity for occasional workloads, teams can scale compute according to analytical demand.
For organizations with different data governance, security, and infrastructure requirements, NebulaGraph Analytics offers three flexible deployment options.
Self-Hosted allows teams to deploy Analytics in their own Kubernetes environment with full control over infrastructure, networking, security, storage, and operations.
Bring Your Own Cloud (BYOC) lets customers keep their cloud environment and data within their own cloud account while NebulaGraph manages the Analytics deployment and day-to-day operations.
Fully Managed provides a managed service so teams can focus on graph analytics and business outcomes rather than platform maintenance.
With flexible data access, CPU-second credit-based pricing, and three deployment options, enterprises can adopt NebulaGraph Analytics with lower barriers and scale graph analytics as their workloads grow.
Conclusion: Build an Enterprise Graph Analytics Foundation
The growth of connected data is creating new opportunities and new challenges for enterprises. Real-time graph processing and offline graph analytics serve different purposes, and organizations increasingly need both to build comprehensive graph-powered applications.
NebulaGraph Analytics provides the analytical foundation for that next layer of graph intelligence.
With scalable graph computing, flexible data access, built-in and custom algorithms, enterprise-ready deployment options, and consumption-oriented pricing, NebulaGraph Analytics helps organizations turn large-scale graph data into actionable intelligence for analytics, machine learning, and AI.
Whether you are detecting fraud, analyzing financial networks, uncovering customer relationships, assessing infrastructure risk, or powering next-generation AI applications, NebulaGraph Analytics provides the platform needed to make complex graph analytics scalable, efficient, repeatable, and production-ready.
Ready to Put Your Graph Data to Work?
Discover how NebulaGraph Analytics can help your organization perform large-scale graph computing, accelerate analytical workloads, and uncover deeper insights from connected data.
Talk to our graph analytics experts right now! 👉 contact us here
Explore More About NebulaGraph Analytics: