release-notesnews
NebulaGraph Enterprise v3.5.0 Released: Significant Query Performance Improvements for Intelligent Decisions and AI Applications
Recently, NebulaGraph Enterprise Edition (v3.5.0) was officially launched. This native distributed graph database has the impressive capability of handling billions of nodes and trillions of edges while maintaining query latency of millisecond-levels. The new version emphasizes the optimization of the database kernel's query performance and stability and comprehensively upgrades the built-in visualization and discovery tools like NebulaGraph Explorer and NebulaGraph Dashboard, making them more user-friendly.
Enhanced Querying Efficiency: Improved Performance
NebulaGraph has a unique storage-compute separation design and native distributed architecture, facilitating real-time exploration of massive data sets. The new version v3.5.0 further enhances the reliability and stability of the distributed system, improving the query performance significantly.
Additionally, data import capabilities and full-text index functions have been optimized to better support full-text retrieval, word segmentation, and match return.
With these improvements, NebulaGraph is equipped to handle real-time processing of complex large-scale data for various business scenarios, such as financial risk control, production management, fraud detection, intelligent Q&A, and investment analysis. It is also suitable for organizing massive industry knowledge graphs and performing AI large-scale model training and multi-type industry intelligence applications.
Lower User Threshold: Visual Querying with No Code Required
NebulaGraph Explorer is a visual graph data exploration tool based on the NebulaGraph kernel. It supports quickly finding friend relationships, analyzing suspicious targets, and executing graph computing analysis from complex relationships and large amounts of data. It displays graph data in a visual way, which can help you easily analyze and explore business data and quickly discover the association relationships in the data.
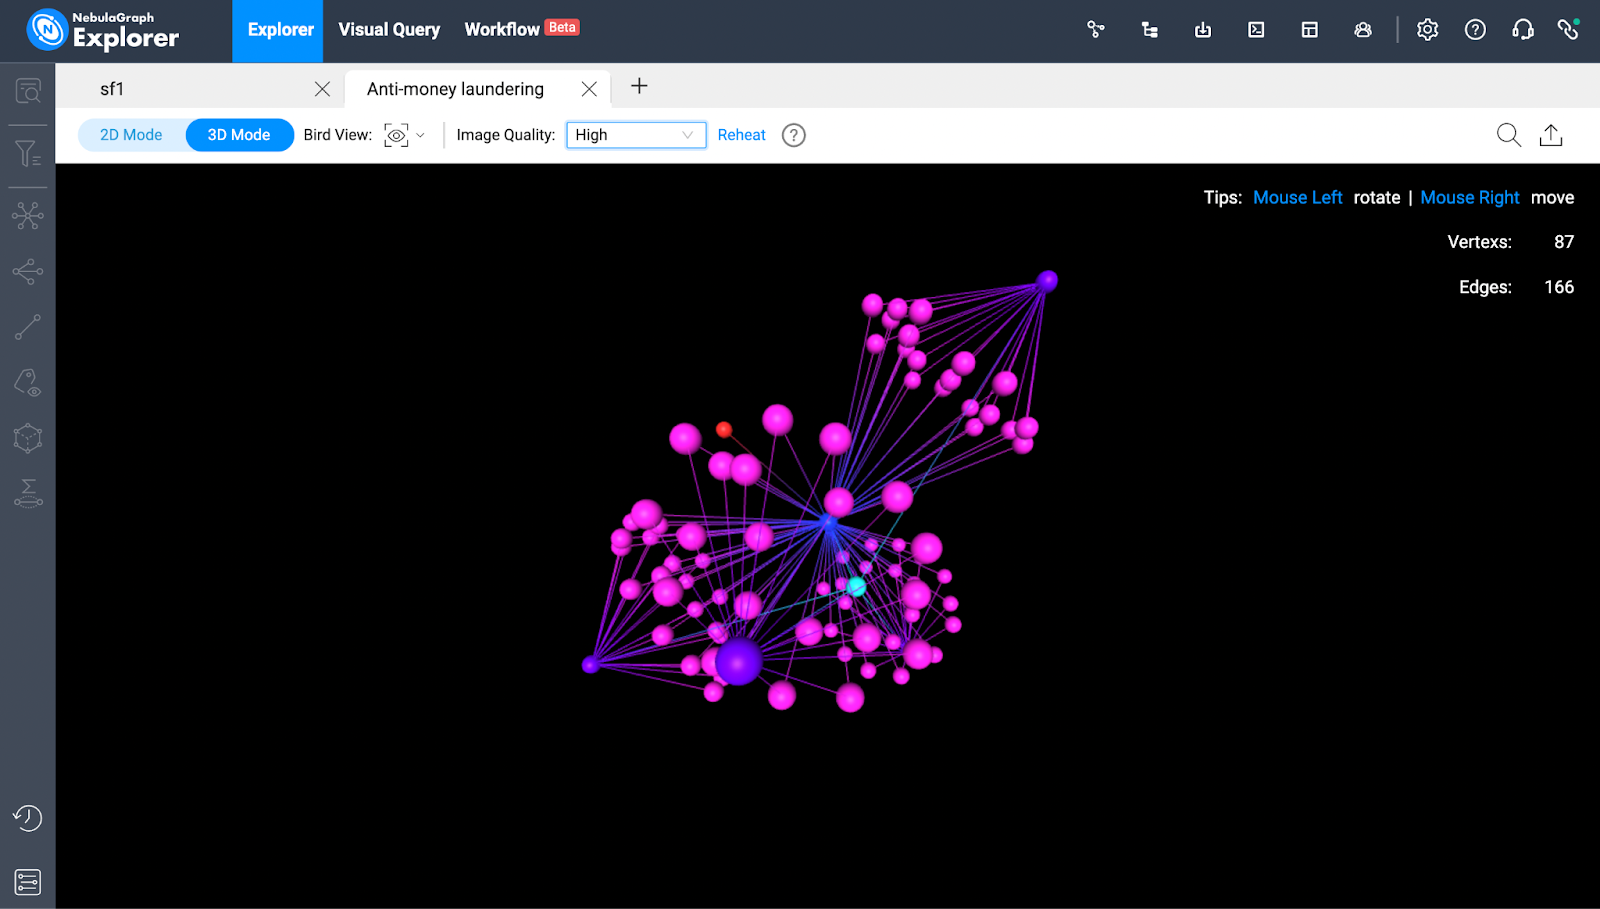
- NebulaGraph Explorer supports 2D/3D visualization data exploration
In terms of data import, NebulaGraph Explorer supports you to import CSV format data into the NebulaGraph database in a visual way. Compared with the previous version, v3.5.0 newly supports cloud storage and SFTP types of data sources, making data import more flexible and convenient.
In terms of data exploration, the workflow function launched supports you to connect graph computing and graph querying in a drag-and-drop manner. You can perform complex graph computing in the visual interface, even if they do not understand the code, they can also achieve visual graph computing through simple clicks.
The new version v3.5.0 further optimizes the user experience of workflow and supports you to save the running results locally, which greatly reduces the time and energy required for you to prepare the environment. In addition, the new version also adds a pre-environment link detection to reduce the probability of runtime errors and greatly improve the usability of workflow.
Simplified Operations Management: Clear Cluster Status
NebulaGraph Dashboard is a visual operations and maintenance tool developed based on the NebulaGraph kernel. In v3.5.0, NebulaGraph Dashboard has been upgraded for cluster monitoring and diagnostic analysis. The new version supports customized monitoring panels. You can select the data indicators displayed on the panel according to the business situation, without the need to switch back and forth between service monitoring and node monitoring. They can grasp the cluster running status on one screen.
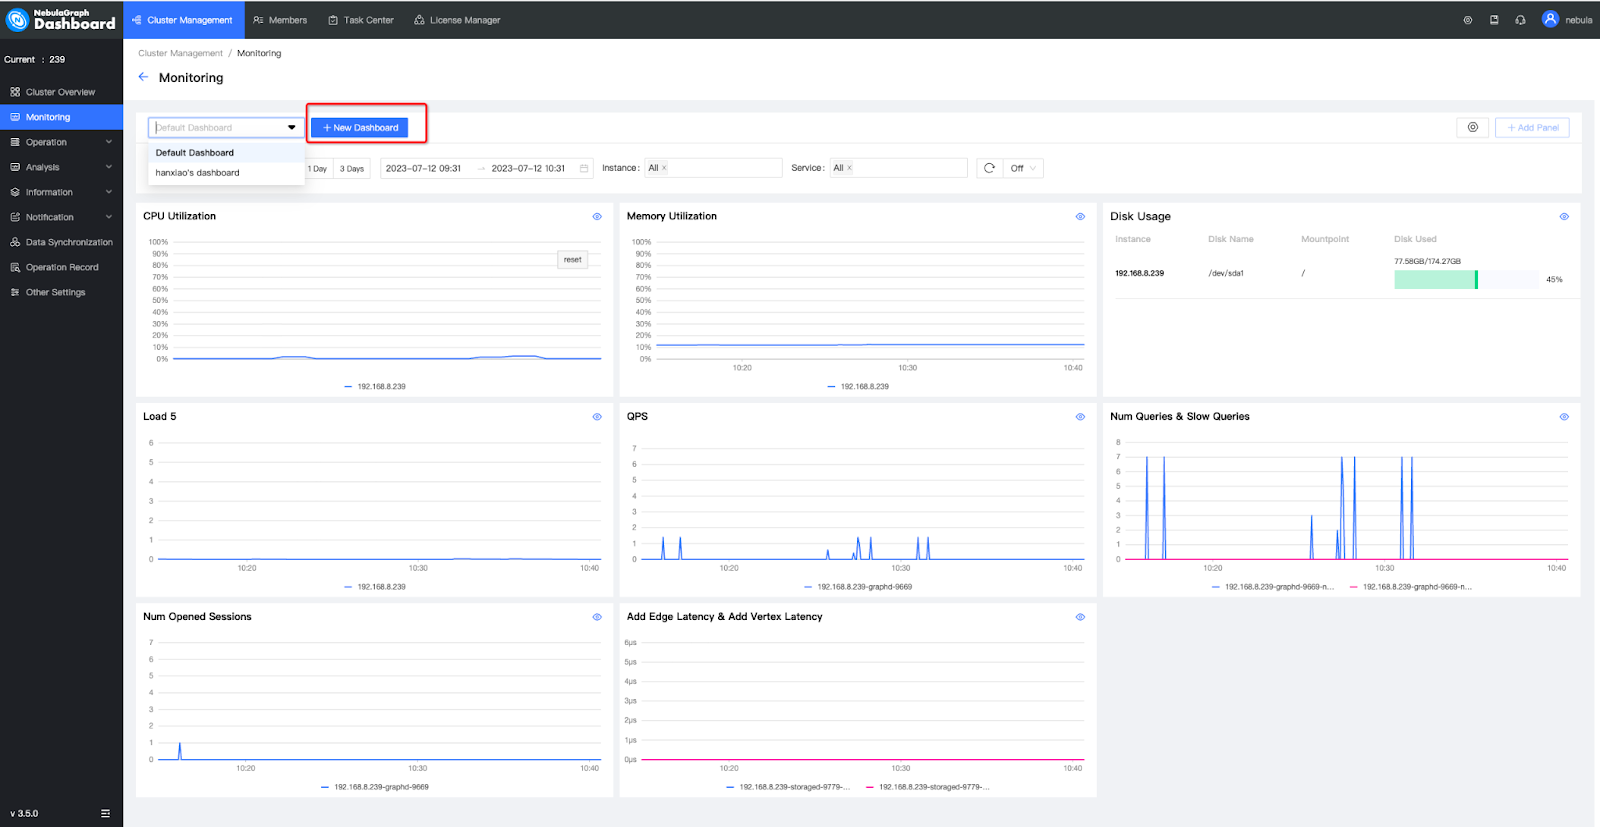
- NebulaGraph Dashboard supports customized data indicators
To enhance the efficiency of database operations and maintenance management, the latest version has optimized and enriched the Cluster Diagnostic Report, providing an easily understandable overview of the cluster's health status, as well as detailed information on individual nodes, services, sessions, and configurations over a historical period. With this information, you can make recommendations for operations and maintenance, and monitor for potential cluster warnings, all with a clear and concise diagnostic report.
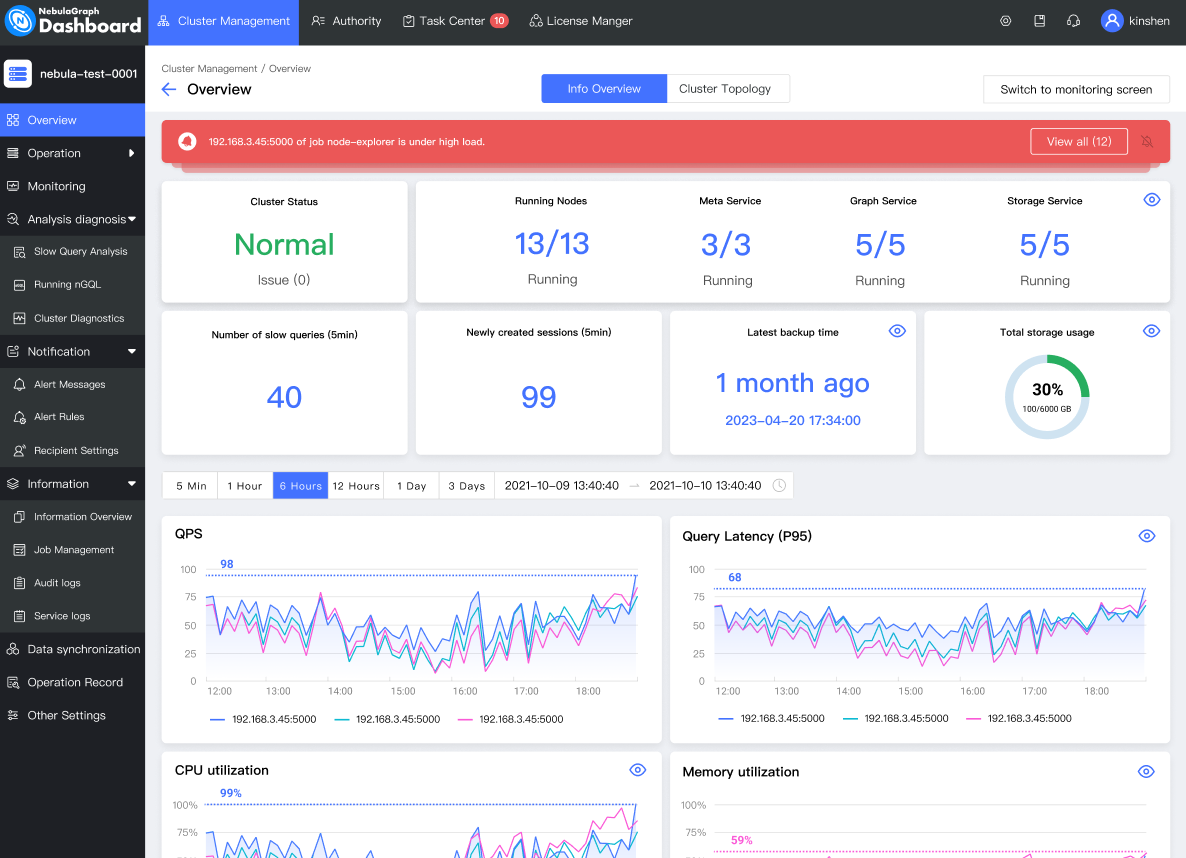
- NebulaGraph Dashboard supports cluster diagnostic reports, allowing you to monitor cluster status at any time
What's more, the new version v3.5.0 adds the Slow Query Analysis function. Through the visual background of NebulaGraph Dashboard, you can always know the basic information and execution time of the slow queries that have been run, which can help DBAs, data engineers, and other users quickly locate slow query statement analysis and performance problems during execution, to make targeted optimizations and further improve the efficiency of operations and maintenance.
NebulaGraph Dashboard also supports one-click deployment of the license management tool (License Manager, LM for short) in a visual way. You can perform LM operation and maintenance management in one place and get timely information about license usage to ensure the healthy operation of the NebulaGraph database kernel and its associated products.
To learn more about NebulaGraph Enterprise Edition, please visit the NebulaGraph website.