LLM
Knowledge Graph QA Using Gemini and NebulaGraph Lite
This article was written by Rajesh K, and originally published at Medium.
Graph databases and knowledge graphs are among the most widely adopted solutions for managing data represented as graphs, consisting of nodes (entities) and edges (relationships). A graph database stores information using a graph-based data model, enabling querying and traversal of the graph structure through specialized graph query languages.
Knowledge graphs extend the capabilities of graph databases by incorporating mechanisms to infer and derive new knowledge from the existing graph data. This added expressiveness allows for more advanced data analysis and extraction of insights across the interconnected data points within the graph.
This article will delve into brief introduction on knowledge graphs followed by generation of knowledge graph using LlamaIndex and nebulagraph-lite.
What is a Knowledge Graph?
A Knowledge Graph serves as a graphical portrayal of interconnected ideas, items, and their relationships, depicted as a network. It includes real-world entities like objects, people, places, and situations. At its core, a Knowledge Graph usually relies on a graph database, which is specifically crafted to manage data by storing discrete pieces of information and the connections between them.
The core components of KG are :
Entities are real-world items or concepts. These consist of humans, places, activities, and summary thoughts. In graph shape, that is a manner of visualizing relationships among information units, entities are represented as nodes or factors on a graph.
Examples:
- Person/s: Barack Obama, Serena Williams
- Places/Locations: New York City, The Great Pyramids
- Events/Events: World War II, 2008 economic crisis
- Abstraction/Ideology: Democracy, Gravity
Relationships describe relationships between objects and describe how they interact or interact with each other. Relationships are represented as edges connecting the corresponding nodes within the expertise graph. The route of this flow can be unidirectional or bidirectional, relying on the character of the entity courting.
Categories of Knowledge Graphs
Knowledge graph has the ability to:
- Effectively manipulate and visualize heterogeneous information: This includes dealing with records of numerous systems inside a unified framework, facilitating clean and insightful illustration.
- Integrate with newer data resources: Knowledge graphs has the inherent flexibility to deal and incorporate facts from novel sources, fostering non-stop expansion of the know-how base.
- Comprehend and depict relationships across any information store: They can discover and represent the interconnections among entities dwelling within various information repositories, allowing a holistic understanding of the underlying relationships.
Following are the graph categories:
- RDF (Resource Description Framework) Triple Stores: These class focus on storing and dealing with information dependent according to the RDF framework, which utilizes triples (situation, predicate, object) to represent understanding.
- Labeled Property Graphs: This class makes a speciality of graphs in which nodes and edges are enriched with informative labels, presenting a more expressive and nuanced illustration of the facts.
RDF (Resource Description Framework) Graphs
RDF graphs, standing for Resource Description Framework graphs, are a way to represent statistics of the web similar to network structure. They are essentially a collection of statements constructed around topics, predicates, and objects.
Imagine a sentence like “Paris is the capital of France”. In an RDF graph, “Paris” will be the issue, “is the capital of” would be the predicate, and “France” will be the item. Together, these three elements form a single “triple” that represents a fact. An RDF graph can incorporate many such triples, constructing an internet of interconnected records.
The Resource Description Framework (RDF) Triple Store constitutes a standardized facts version for know-how representation. Within this model, every element is assigned a unique identifier the use of Uniform Resource Identifiers (URIs). This mechanism ensures machine-readable identity of topics, predicates, and gadgets. Furthermore, RDF Triple Stores leverage a standardized question language known as SPARQL. This language allows the retrieval of records from the store. Owing to the standardized nature of both information representation and querying, RDF Triple Stores show off interoperability with another understanding graph that clings to the RDF framework.
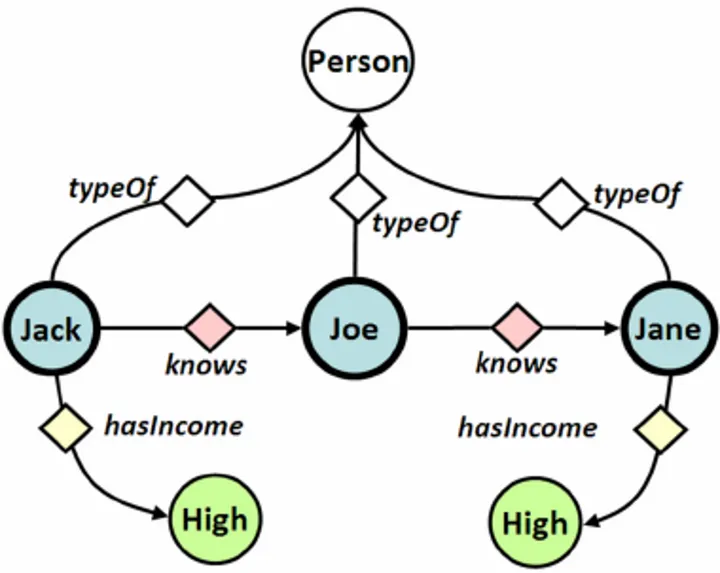
The graph above depicts individuals (round nodes) inside a social community. Lines (directed links) constitute friendships among them. Additionally, hasincome is related to every individual (dark-rimmed node). Diamond-fashioned nodes depict the opportunity of extra data current within the community (triples).
Pros of RDF graphs:
- Interoperability: RDF is a W3C trendy, which means that specific systems can apprehend and alternate records stored in RDF graphs. This makes it a great choice for sharing data throughout platforms and packages.
- Standardization: Due to the standardized format, RDF graphs include a trendy question language known as SPARQL. This makes it less difficult to discover and examine the records saved inside the graph.
- Reasoning and Inference: RDF graphs can leverage ontologies (think of them as formal descriptions of ideas) to purpose about the information. This allows the machine to infer new statistics that isn’t explicitly stated inside the graph.
- Flexibility: RDF graphs can represent an extensive form of facts types and relationships. This makes them appropriate for modeling complicated domains and integrating facts from exceptional sources.
Cons of RDF graphs:
- Complexity for Deep Searches: Traversing large RDF graphs for deep searches can be computationally expensive. This can gradual down queries that need to discover many connections.
- Strict Structure: RDF information is saved as "triples" (difficulty, predicate, object). This can be less flexible than different graph fashions that allow for properties on entities or relationships themselves.
- Steeper Learning Curve: Understanding and operating with RDF requires a good hold close of the underlying standards and the SPARQL question language. This can pose a challenge for new users.
Labeled Property Graphs (LPGs)
Labeled property graphs (LPGs) are a special type of graph database model used to represent information with interconnected services and their relationships. Here is a breakdown of their highlights:
- Nodes: These represent masculine or feminine elements in realities. Each node has a very unique description and can be assigned one or more labels to indicate its type or size (e.g., “person”, “product”).
- Properties: Nodes can have key charge pairs associated with them, which store additional data about the entity. These fields allow for basic definitions of the elements in the graph.
- Edges: These represent connections between nodes, and show relationships between entities. Like nodes, edges can be marked with a selection of methods (e.g., “knows”, “buys”) and can also have their own properties associated with them.
Key characteristics of LPGs:
- Rich data structure: The ability to have properties on both nodes and edges allows for denser and more informative data representation compared to other models like RDF.
- Efficient storage and querying: The LPG structure often leads to efficient storage mechanisms and faster traversal of connections within the graph for queries.
- Flexibility: LPGs are flexible due to the lack of a predefined schema. This allows for modeling diverse data relationships.
RDF vs. Property Graphs

Property Graphs QA with LLM
Property graphs and Large Language Models (LLMs) are powerful tools that can be used together to gain new insights from data. Here’s how they can work together:
Data Augmentation:
- LLMs can be used to generate text descriptions for nodes and edges in a property graph. This can enrich the data and make it easier for other tools or users to understand the relationships.
- LLMs can also be used to generate new nodes and edges based on existing data in the graph. This can be helpful for tasks like anomaly detection or fraud prediction.
Querying and Exploration:
- LLMs can be used to create natural language interfaces for querying property graphs. This allows users to ask questions about the data in a more intuitive way than using a traditional graph query language.
- LLMs can also be used to summarize the results of graph queries and generate explanations for the findings.
Reasoning and Inference:
LLMs can be used to perform reasoning tasks over property graphs. This could involve inferring new relationships between nodes based on existing data or identifying inconsistencies in the graph.
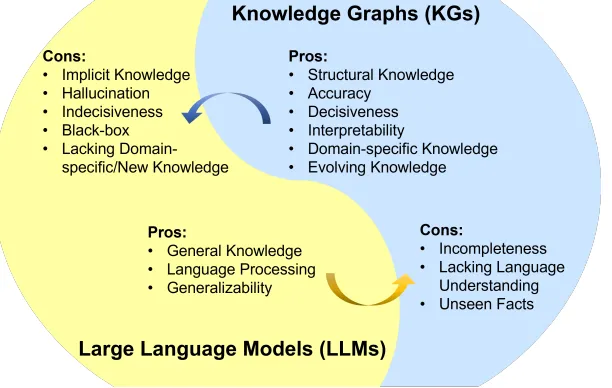
Below is demonstration for the stepwise implementation of Knowledge Graph using LlamaIndex KnowledgeGraphIndex and NebulaGraph Lite Reference using Google Gemini LLM and Collab.
Generate API Key for Gemini
Head on to https://aistudio.google.com/app/prompts/new_chat and generate a new API Key.
Load the PDF document
! mkdir ad && cd ad
! curl https://arxiv.org/pdf/2106.07178.pdf --output AD1.pdf
! mv *.pdf ad/
! pip install -q transformers

%pip install llama_index pyvis Ipython langchain pypdf  llama-index-llms-huggingface  llama-index-embeddings-langchain llama-index-embeddings-huggingface
%pip install --upgrade --quiet llama-index-llms-gemini  google-generativeai
%pip install --upgrade --quiet llama-index-graph-stores-nebula nebulagraph-lite
Import the google API key
import os

from google.colab import userdata
GOOGLE_API_KEY = userdata.get('GOOGLE_API_KEY')
os.environ["GOOGLE_API_KEY"] = GOOGLE_API_KEY
Import the required modules and libraries
import logging
import sys

logging.basicConfig(stream=sys.stdout, level=logging.INFO)
logging.getLogger().addHandler(logging.StreamHandler(stream=sys.stdout))
from llama_index.core import (
                         ServiceContext,
                         KnowledgeGraphIndex)
from llama_index.core import SimpleDirectoryReader
from llama_index.core.storage.storage_context import StorageContext
from pyvis.network import Network

from llama_index.llms.huggingface import HuggingFaceLLM
Check for supported gemini Models; here we will be using Gemini 1.0 pro model.
import google.generativeai as genai


for m in genai.list_models():
    if "generateContent" in m.supported_generation_methods:
        print(m.name)
        print(m)
from llama_index.llms.gemini import Gemini

llm = Gemini(model="models/gemini-1.0-pro-latest")
Import the BGE embedding
from llama_index.embeddings.huggingface import HuggingFaceEmbedding
from llama_index.core import ServiceContext


embed_model = HuggingFaceEmbedding(model_name="BAAI/bge-small-en-v1.5")
Load the contents of the ad directory
documents = SimpleDirectoryReader("/content/ad").load_data()
print(len(documents))
Start the Nebula graph store lite version docker instance locally.
from nebulagraph_lite import nebulagraph_let
n = nebulagraph_let(debug=False)
n.start()
Set up namepsace named “nebula_ad “ and nodes in nebula store
%ngql --address 127.0.0.1 --port 9669 --user root --password nebula
# If not, create it with the following commands from NebulaGraph's console:
%ngql CREATE SPACE nebula_ad(vid_type=FIXED_STRING(256), partition_num=1, replica_factor=1)
import time

print("Waiting...")

# Delay for 10 seconds
time.sleep(10)

%ngql --address 127.0.0.1 --port 9669 --user root --password nebula
%ngql USE nebula_ad;
%ngql CREATE TAG entity(name string);
%ngql CREATE EDGE relationship(relationship string);
Load the document data to the graph store
import os
os.environ["NEBULA_USER"] = "root"
os.environ["NEBULA_PASSWORD"] = "nebula"  # default is "nebula"
os.environ[
    "NEBULA_ADDRESS"
] = "127.0.0.1:9669"  # assumed we have NebulaGraph installed locally

space_name = "nebula_ad"
edge_types, rel_prop_names = ["relationship"], [
    "relationship"
]  # default, could be omit if create from an empty kg
tags = ["entity"]  # default, could be omit if create from an empty kg
from llama_index.core import StorageContext
from llama_index.graph_stores.nebula import NebulaGraphStore

graph_store = NebulaGraphStore(
    space_name=space_name,
    edge_types=edge_types,
    rel_prop_names=rel_prop_names,
    tags=tags,
)
storage_context = StorageContext.from_defaults(graph_store=graph_store)
from llama_index.core import Settings

Settings.llm = llm
Settings.embed_model = embed_model
Settings.chunk_size = 512
update the nodes data in graph store
# NOTE: can take a while!
index = KnowledgeGraphIndex.from_documents(
    documents,
    storage_context=storage_context,
    max_triplets_per_chunk=10,
    space_name=space_name,
    edge_types=edge_types,
    rel_prop_names=rel_prop_names,
    tags=tags,
    include_embeddings=True
)
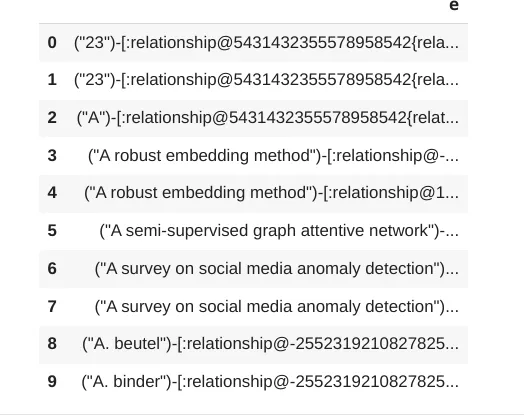
Check the inserted graph data in nebula store
# Query some random Relationships with Cypher
%ngql USE nebula_ad;
%ngql MATCH ()-[e]->() RETURN e LIMIT 10
Output
Now query the indexed data
query_engine = index.as_query_engine()
from IPython.display import display, Markdown

response = query_engine.query(
    "Tell me about Anomaly?",
)
display(Markdown(f"<b>{response}</b>"))
Anomalies, also known as outliers, exceptions, peculiarities, rarities, novelties, etc., in different application fields, refer to abnormal objects that are significantly different from the standard, normal, or expected.
from IPython.display import display, Markdown

response = query_engine.query(
    "What are graph anomolies?",
)
display(Markdown(f"<b>{response}</b>"))
Graph anomalies can be defined as structural anomalies.
Conclusion
These simple Knowledge graphs demonstrably capture intricate relationships between entities. This capability facilitates significantly more precise, diverse, and complex querying and reasoning. These can also be extended to complex RDF-based ontology graphs. In the future, we will refine more on the different aspects of how Knowledge graphs can be utilized for RAG and LLM fine-tuning.
Happy Graphing!
