Knowledge Graphs
Jul 12, 2022
Financial Fraud Detection: One of the Best Practices of Knowledge Graph
NebulaGraph
Financial Fraud Detection: One of the Best Practices of Knowledge Graph
Hello, I'm Qingxin Kong from Bangsun Technology. I'm glad that I have this opportunity to share the topic Financial Fraud Detection: Best Practices of Knowledge Graph with NebulaGraph community members.
Background: Problems with traditional fraud detection solutions
Financial frauds remain a hot topic in recent years. There's a new trend emerging that fraudsters are organized and ganged up on. It is difficult to verify whether the customer's information provided is fake or not. Such inconsistent information makes it difficult to identify the real frauds and leads to a lot of problems. The bank may control the passing rate by raising the requirements to handle loan applications due to the uncertainty of the customer's information, which is effective but brings losses.
The 2022 government work report said that financial inclusion will be further expanded and the customer base will include rural customers, which means there will be "white accounts" having no credit reports. Traditional fraudulent behaviors include fake credit reports, commission agencies, and collusion.
Some agencies focus on a few banks for credit card applications or loans. Those agencies know the bottom line and red line of the banks. As long as the bottom line is not touched, they can successfully apply for loans. Those agencies may even know how to make the loan amount higher.
Traditional fraud detection solutions rely heavily on expert rules, that is, risk control experts set a batch of rules through experience and then adjust the trigger conditions to find a business balance between the pass rate and rejection rate. It costs little to forge things like ID numbers and bank card flows. There are no good means of control for mass and high-volume frauds.
Empowering graphs: Paths to intelligent fraud detection solutions
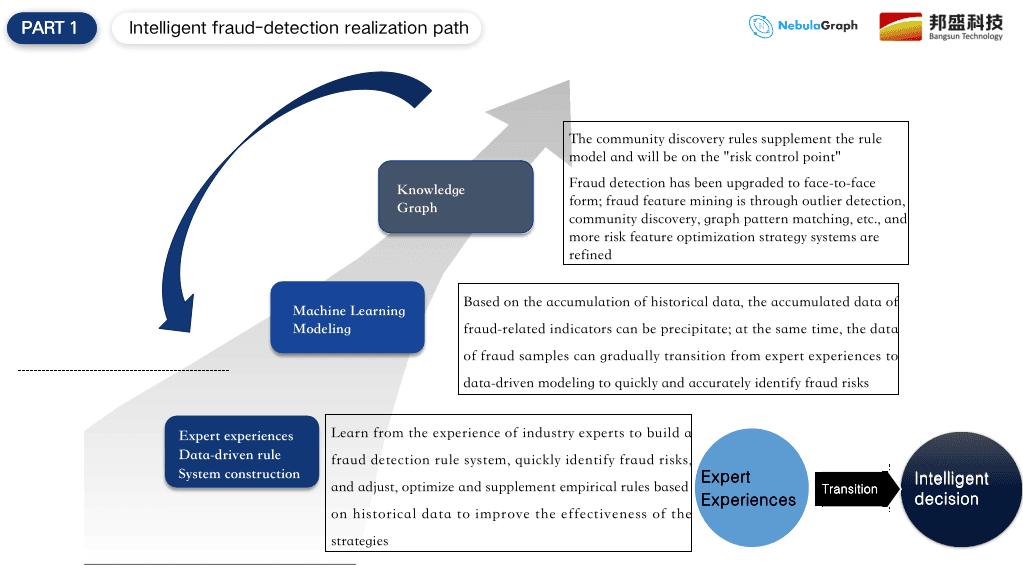
Let's take a look at the development path of intelligent fraud detection solutions.
The first step is to build expert rules, but it is difficult to cover all risks through expert experience. The second step is to build a machine learning model to prevent and control the overall risk and then use expert rules to help the model. Expert rules and machine learning models well complement each other. However, based on the current experience, we may face lots of problems when building the machine learning model. The first reason is insufficient data and the second is the limited growth of the sample data. Because there are probably be 6~7 ways to apply for loans or credit cards, manual inspection is required in the end, so the data growth is very low. There will be a case below to explain the problem.
Therefore, we need to use relational graphs to crack the problems of information inconsistency. Both group and agency frauds have a batch of application behaviors. We can use the visualized graphs to recognize fraud samples. In this way, we may capture dozens to hundreds of fraudulent applications. It is also a very effective way for sample replenishment. Graphs can also be used for consistency checks. The multiple sources of information prove the information inconsistency. Graphs are displayed from the dimension of relations which helps us to do secondary verification. For example, multiple applications sharing the same information like the same phone number and IP address are considered group fraud.
To detect these group frauds, we use graphs that help us find rules of relations. These rules are complementary to the original expert rules. On the other hand, we can extract graph information to optimize machine learning patterns which increases the pattern's ability to detect group frauds and label more suspicious objects. Therefore, the expert rules, machine learning models, and graphs construct an effective ecological closed loop and complement each other to detect frauds.
In terms of the specific applications of relational graphs, I've listed the following applications:
Application Graph: An example is using graphs to detect fraudulent applicants for loans and credit cards. One characteristic of a group is that information is shared by the group members. From the visual queries of graph data, a lot of correlations will be found. The more common information includes identity card, cell phone number, device fingerprint, e-mail address, etc. We use this information to explore relationships among these data, and then visually analyze the specific fraudulent techniques.
Transaction Graph: For multi-level transfer relationships, we mainly focus on the final flow of funds and who are the beneficiaries. The recent gambling fraud issue is the main focus of concern for financial supervisors, which is also one of the main directions we focus on. We have many customer cases. Through the list of suspects provided by the supervision of our internal rule models, suspicious transactions can be detected. In this process, we use historical flow data to explore more layers of data starting with the collected accounts. We may also use the graph exploration feature or a graph platform to analyze existing data for incremental prevention and control.
Enterprise Graph/Internal Control Graph: Nowadays, there are interconnections between two or more enterprise businesses. The impact of external risks on the enterprise is increasing. Using graphs can outline the whole picture of risks for an enterprise. Combined with the introduction of external risks, the impact of external risks on the enterprise can be predicted as early as possible. Internal control graphs are more often used for detecting ethical or operational risks, such as misuses or failure to do certain operations in accordance with rules and regulations. Moral risks occur more often in unusual financial transactions between employees and enterprises, such as illegal fundraising or misappropriation of funds. The prevention core is to use graphs to check the actual control accounts of employees. Because bank employees are well acquainted with the bank's business. Few employees take their own accounts for some crimes. The identification of these control accounts can be explored by the means of graphs. For example, the accounts of relatives. We have a case of a joint-stock bank. In this case, the target was located in the account of the employee's girlfriend, because from visual graphs we found that many funds actually flowed to the girlfriend's account. It is very difficult to detect a case like this by traditional means.
Money Laundering Graph: The money laundering problem has existed for a long time. There are many derivative money laundering ways in different periods. Popular ways include the underground money bank and the "order sneaking" platform. Criminals hide their money on the platform where order-sneaking customers' daily consumption transactions are normal, however, there is actually a fixed pattern on visual graphs to detect cases like this. So how creating business relations with graphs and making graph rules to perform real-time monitoring and detections have become an important task for Bangsun, taken as a graph technology platform, to empower business developers. We will talk about it later.
Vehicle Insurance/Ops Graph: For the vehicle insurance/ops field, we combine the initialization network with the design of vertices and edges, then query for a subgraph where the data is relatively appropriate and related, and then combine the experience of business experts to perform some exploratory and analytical work.
Use case 1: Flow of funds
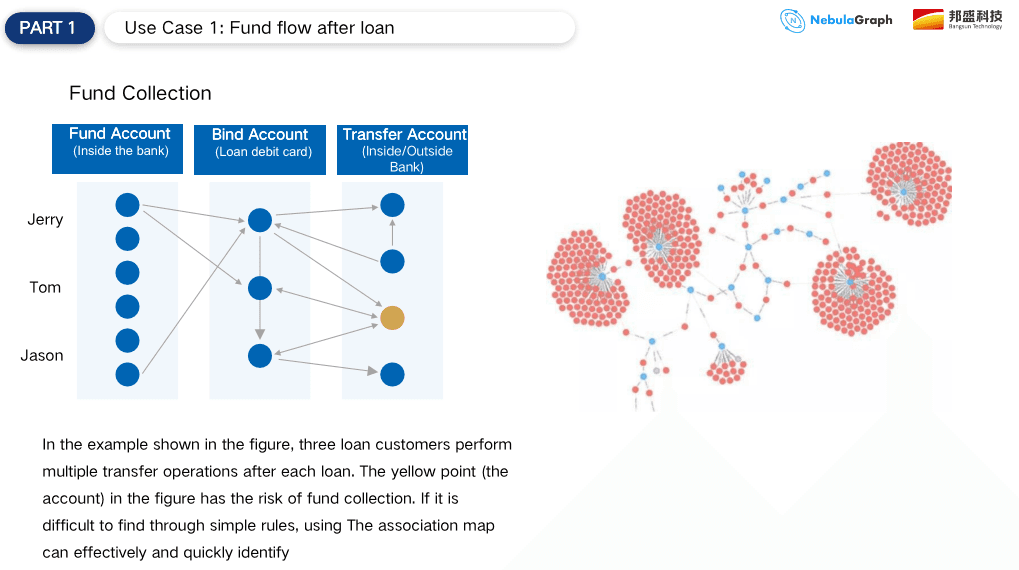
Here, some specific application scenarios are also briefly listed. The first one is the flow of funds after the loan is approved.
We can focus on business and consumer loans through graphs, and track whether the approved loans flow into the housing market or the stock market. In this process, we will use the penetration ability of graphs to calculate the amount and proportion of transferred funds. Thereafter, we can easily find risks and violations and provide a basis for investigation. The regulators currently follow the principle of "three approaches and one guideline" for internet credits, so we establish real-time risk control through graphs and focus on the fund flows.
Next, we can show the specific methods. For example, loans flow directly into the blacklisted accounts or their own accounts are transferred to an account not under their name, but the account may be a controlled account. The account is used for investment and financial management. These can be analyzed with graphs and the specific pattern of the funds because the fund flows will form a very obvious distribution or pattern on visual graphs.
This pattern is difficult to portray with the previous expert rules, because the expert rules can only find a one-dimensional relationship, up to two-dimensional relationships, while the graphs are more adept at multi-dimensional relationship detecting. In massive transaction structures, we can also find some patterned structures. For example, the above figure shows 4-5 vertices, which involve some centralized transfer in, decentralized transfer out, and chain transaction structures like tree branches and ant nests, which are all abnormal funding patterns. Through visual graphs and combination with business knowledge, in many cases, we can see that it is problematic at a glance. As for where the specific problem is, we can check it through some functions provided by the graph, such as the k-degree query or the discovery algorithm of important nodes.
Use case 2: Insurance frauds
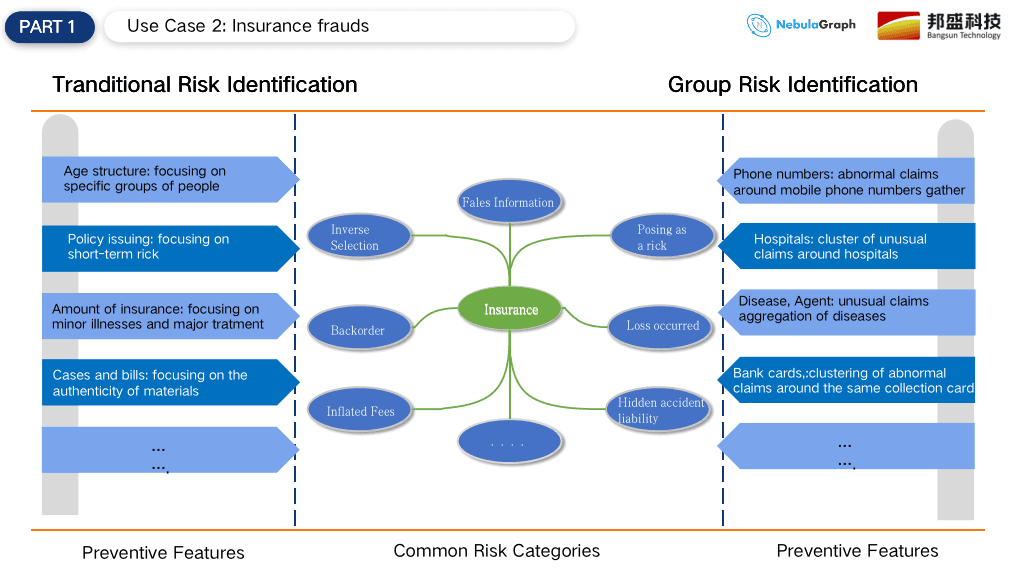
The second use case is frauds in insurance, such as vehicle insurance or health insurance. The primary vehicle insurance issues are collusive claim frauds. By monitoring and associating shared identity information, it is easier to find group members and excludes irrelevant data. As for health insurance, we generally focus more on the improper relationship between doctors and patients or providers. Once there is a large number of discrete values on a drug or disease, it represents fraud. This is the common way to detect individual fraud in the past. Now the group fraud problem is severe. Group fraudsters have a shift in thinking that dozens of accounts buy the same drug through individual payment accounts. There are also aggregation accounts and many other commonalities. Combined with graph analysis and algorithms, those group frauds can be detected.
Summary: Advantages of graph fraud detection
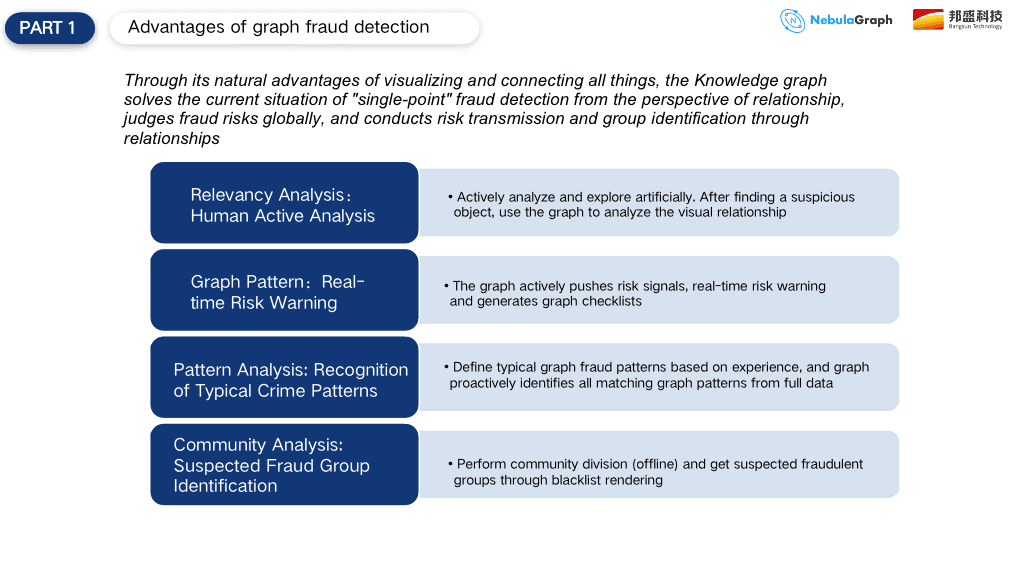
The advantages of graph fraud detection mainly include the following four aspects.
Association analysis: This means that people take the initiative to explore and discover suspicious features, and then use graphs to make some visual associations. Business developers take the initiative to use graph tools for visual exploration and then combine the features of different business areas, such as money laundering, credit card applications, and loan applications to find some suspicious points. The suspicious points are certainly different in different areas, but the business developers who often use graph tools have a certain sensitivity to such suspicious points.
Graph rules: This aspect is more for incremental monitoring. Unlike the previous expert rules, graph rules use the means of graph exploration associated with knowledge comparison to draw some conclusions. We conclude graph rules from the dimension of relationships, and then the system uses the rules to detect risks.
Pattern analysis: We recently called the same model, because many fraud patterns have a solidified pattern, such as cash-out from credit cards. After analyzing these solidified patterns, we convert the pattern in a graph query language into a graph library for a traversal query. Compared to the graph rules introduced above, it is a method for detecting existing data.
Community analysis: As mentioned above, insufficient data is lacking for modeling graph data, the community analysis is actually a very good feature to discover fraudulent groups by algorithms and combination with data labels.
The above four graph fraud detection advantages can help us detect frauds in real-time, on time, and afterward. They are both the main graph functions for anti-frauds and are considered our strengths. These advantages are currently applied by about dozens of our customers.
This is all we have for today's article! Please look forward to the next topic Introduction of Bangsun Knowledge Graph Platform and Practical Cases of State-owned Banks.
